File list
This special page shows all uploaded files.
First page |
Previous page |
Next page |
Last page |
| Date | Name | Thumbnail | Size | Description | Versions |
|---|---|---|---|---|---|
| 17:49, 8 February 2018 | Wtp table 26.JPG (file) |  |
90 KB | Wtp table 26 | 1 |
| 17:49, 8 February 2018 | Wtp table 25.JPG (file) |  |
105 KB | Wtp table 25 | 1 |
| 17:48, 8 February 2018 | Wtp table 24.JPG (file) |  |
46 KB | Wtp table 24 | 1 |
| 17:48, 8 February 2018 | Wtp table 23.JPG (file) |  |
34 KB | Wtp table 23 | 1 |
| 17:48, 8 February 2018 | Wtp table 22.JPG (file) |  |
42 KB | Wtp table 22 | 1 |
| 17:47, 8 February 2018 | Wtp table 21.JPG (file) |  |
71 KB | Wtp table 21 | 1 |
| 17:47, 8 February 2018 | Wtp table 20.JPG (file) |  |
100 KB | Wtp table 20 | 1 |
| 17:47, 8 February 2018 | Wtp table 19.JPG (file) |  |
127 KB | Wtp table 19 | 1 |
| 17:46, 8 February 2018 | Wtp table 18.JPG (file) |  |
47 KB | Wtp table 18 | 1 |
| 17:46, 8 February 2018 | Wtp table 17.JPG (file) |  |
34 KB | Wtp table 17 | 1 |
| 17:46, 8 February 2018 | Wtp table 16.JPG (file) |  |
42 KB | Wtp table 16 | 1 |
| 17:45, 8 February 2018 | Wtp table 15.JPG (file) |  |
72 KB | Wtp table 15 | 1 |
| 17:45, 8 February 2018 | Wtp table 14.JPG (file) |  |
100 KB | Wtp table 14 | 1 |
| 17:06, 8 February 2018 | Wtp table 13.JPG (file) |  |
119 KB | WTP table 13 | 1 |
| 17:06, 8 February 2018 | Wtp table 12.JPG (file) |  |
46 KB | WTP table 12 | 1 |
| 17:06, 8 February 2018 | Wtp table 11.JPG (file) |  |
32 KB | WTP table 11 | 1 |
| 17:05, 8 February 2018 | Wtp table 10.JPG (file) |  |
42 KB | WTP table 10 | 1 |
| 17:05, 8 February 2018 | Wtp table 9.JPG (file) |  |
71 KB | WTP table 9 | 1 |
| 17:05, 8 February 2018 | Wtp table 8.JPG (file) |  |
98 KB | WTP table 8 | 1 |
| 16:24, 8 February 2018 | Wtp eq 7.JPG (file) | 9 KB | Equation 7 | 1 | |
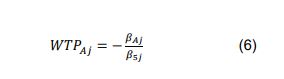
| 16:24, 8 February 2018 | Wtp eq 6.JPG (file) |  |
9 KB | Equation 6 | 1 |
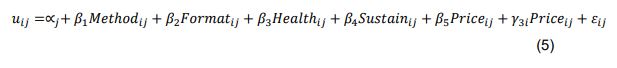
| 16:24, 8 February 2018 | Wtp eq 5.JPG (file) | 14 KB | Equation 5 | 1 | |
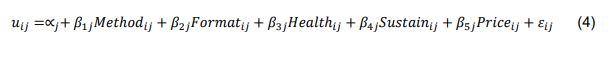
| 16:23, 8 February 2018 | Wtp eq 4.JPG (file) | 13 KB | Equation 4 | 1 | |
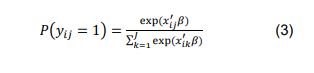
| 16:23, 8 February 2018 | Wtp eq 3.JPG (file) | 10 KB | Equation 3 | 1 | |
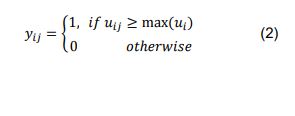
| 16:23, 8 February 2018 | Wtp eq 2.JPG (file) |  |
11 KB | Equation 2 | 1 |
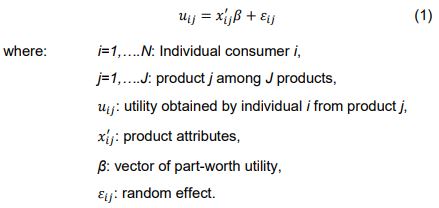
| 16:22, 8 February 2018 | Wtp eq 1.JPG (file) |  |
21 KB | Equation 1 | 1 |
| 15:54, 8 February 2018 | Wtp figure 11.jpg (file) |  |
25 KB | Figure 11: Belief strength about the nutritional and health claim. | 1 |
| 15:53, 8 February 2018 | Wtp figure 10.jpg (file) |  |
25 KB | Figure 10: Belief strength about the sustainability label. | 1 |
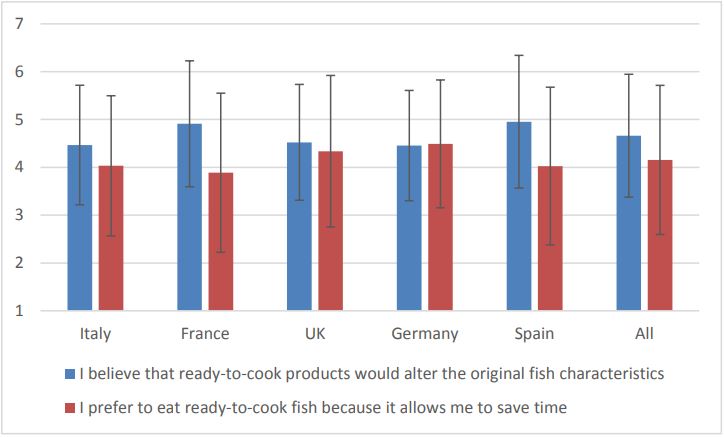
| 15:52, 8 February 2018 | Wtp figure 9.jpg (file) |  |
45 KB | Figure 9: Attitude towards ready-to-cook fish. | 1 |
| 15:52, 8 February 2018 | Wtp figure 8.jpg (file) |  |
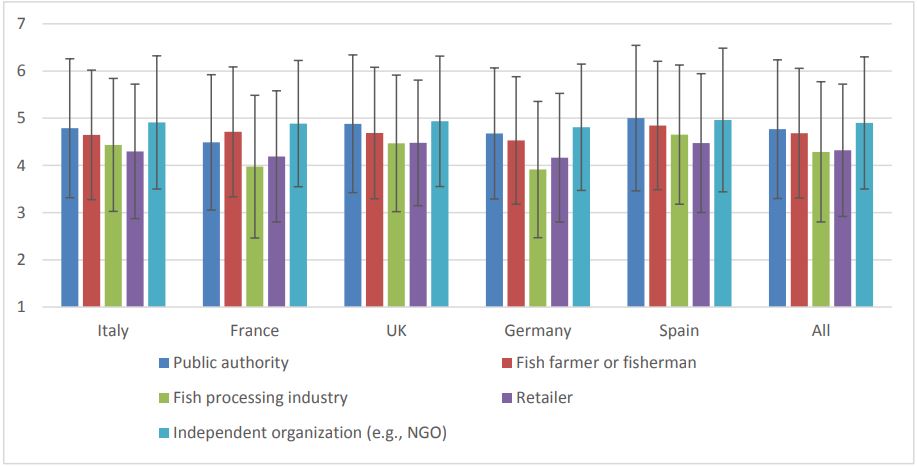
62 KB | Figure 8: Trust for information about sustainable fish production. | 1 |
| 15:51, 8 February 2018 | Wtp figure 7.jpg (file) |  |
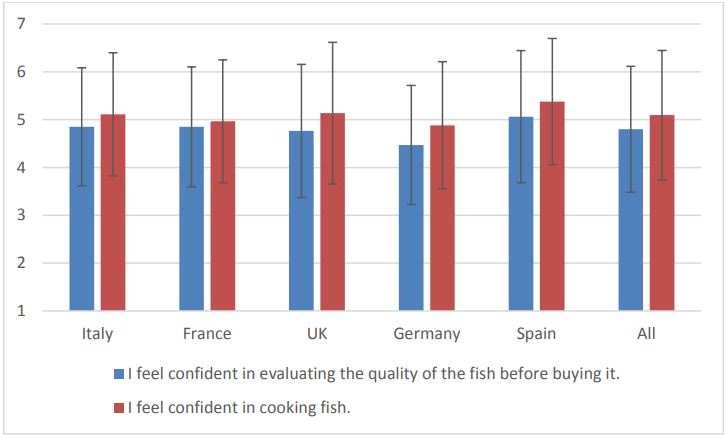
44 KB | Figure 7: Self-efficacy. | 1 |
| 15:51, 8 February 2018 | Wtp figure 6.jpg (file) |  |
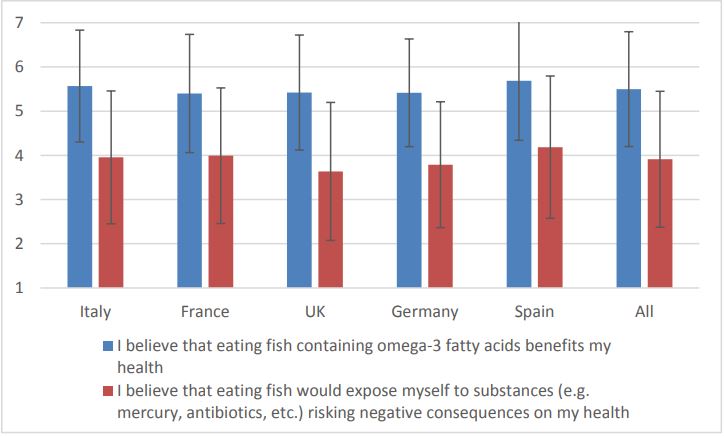
48 KB | Figure 6: Attitude towards health concerns. | 1 |
| 15:50, 8 February 2018 | Wtp figure 5.jpg (file) |  |
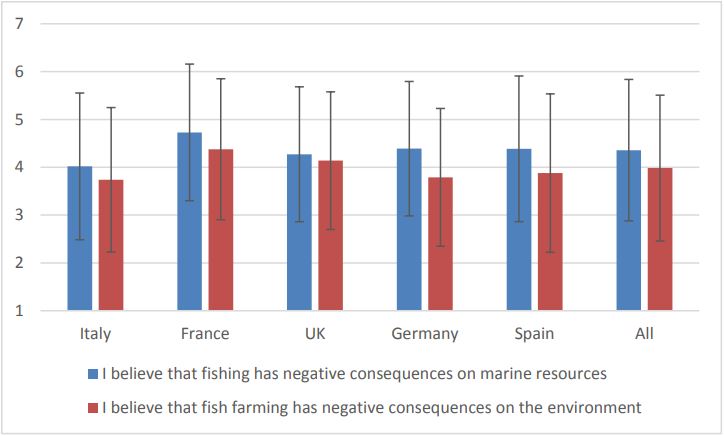
44 KB | Figure 5: Attitude towards environmental concerns. | 1 |
| 15:43, 8 February 2018 | Wtp figure 4.jpg (file) |  |
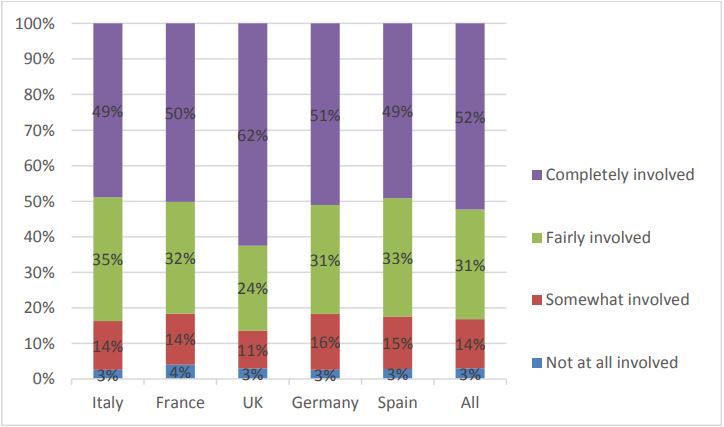
43 KB | Figure 4: Level of involvement in your household when preparing and cooking fish. | 1 |
| 15:42, 8 February 2018 | Wtp figure 3.jpg (file) |  |
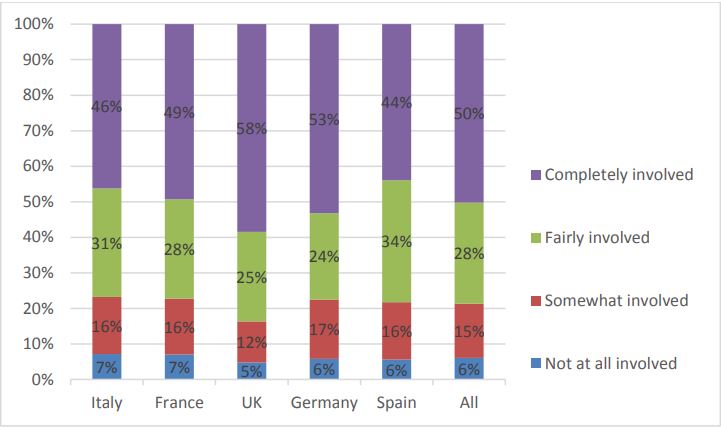
42 KB | Figure 3: Level of involvement in fish purchasing in your household. | 1 |
| 15:36, 8 February 2018 | Wtp figure 2.jpg (file) |  |
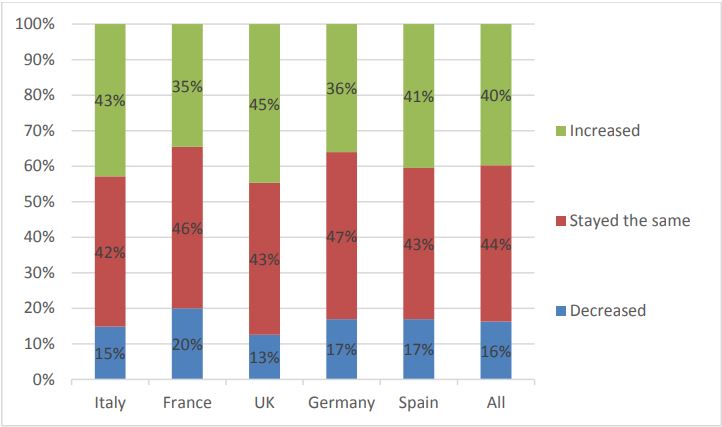
40 KB | Figure 2: Evolution of fish consumption in the past 3 years. | 1 |
| 15:35, 8 February 2018 | Wtp figure 1.jpg (file) |  |
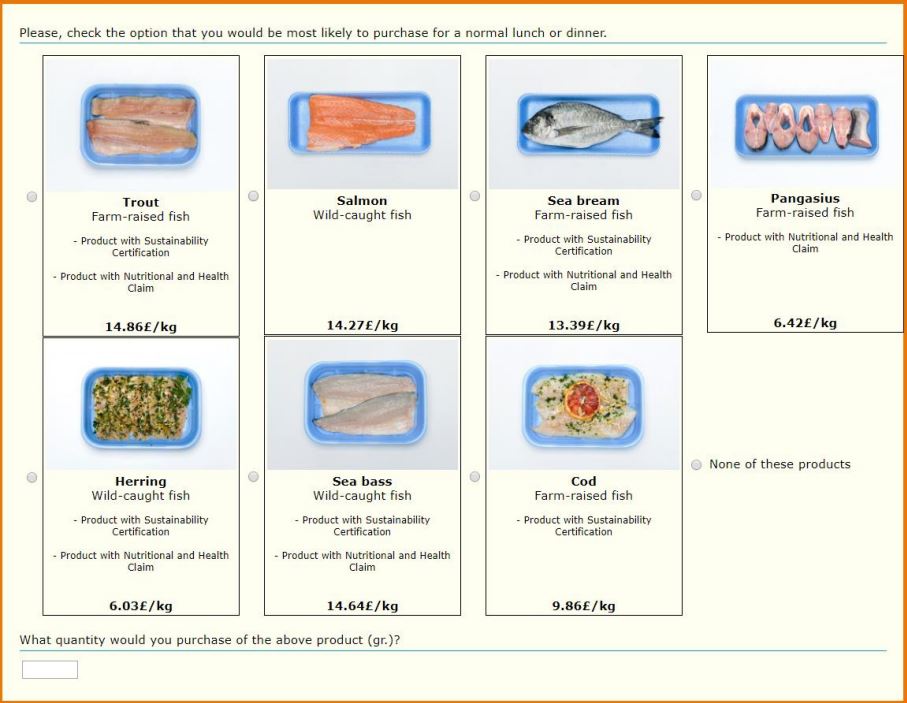
92 KB | Figure 1: Example of choice set. | 1 |
| 02:25, 6 February 2018 | Cpa figure6.png (file) |  |
18 KB | Figure 6 - CPA - Individual firm indicators – threat of new entrants. | 2 |
| 02:18, 6 February 2018 | Cpa figure11.jpg (file) |  |
21 KB | Figure 11 - CPA - Individual firm indicators – rivalry – last six indicators | 1 |
| 02:16, 6 February 2018 | Cpa figure10.jpg (file) |  |
23 KB | Figure 10 - CPA - Individual firm indicators – rivalry | 1 |
| 02:14, 6 February 2018 | Cpa figure9.jpg (file) |  |
19 KB | Figure 9 - CPA - Individual firm indicators – threat of substitutes | 1 |
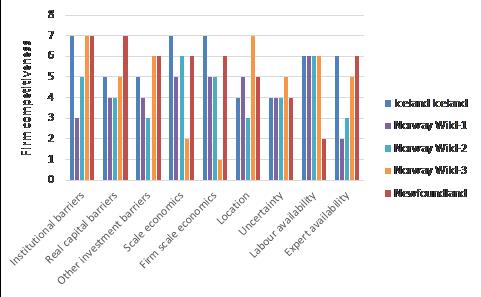
| 02:12, 6 February 2018 | Cpa figure8.jpg (file) |  |
23 KB | Figure 8 - CPA - Individual firm indicators – bargainging power of buyers | 1 |
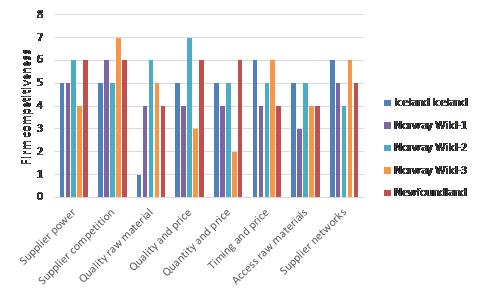
| 02:10, 6 February 2018 | Cpa figure7.jpg (file) |  |
25 KB | Figure 7 - CPA - Individual firm indicators – bargaining power of suppliers | 1 |
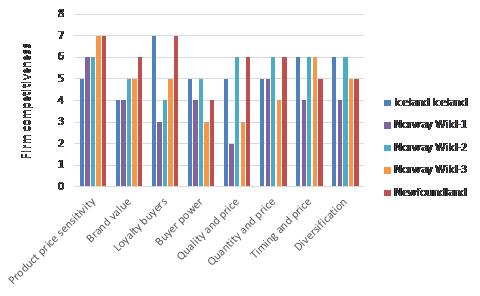
| 02:07, 6 February 2018 | Cpa figure6.jpg (file) |  |
24 KB | Figure 6 - CPA - Individual firm indicators – threat of new entrants. | 1 |
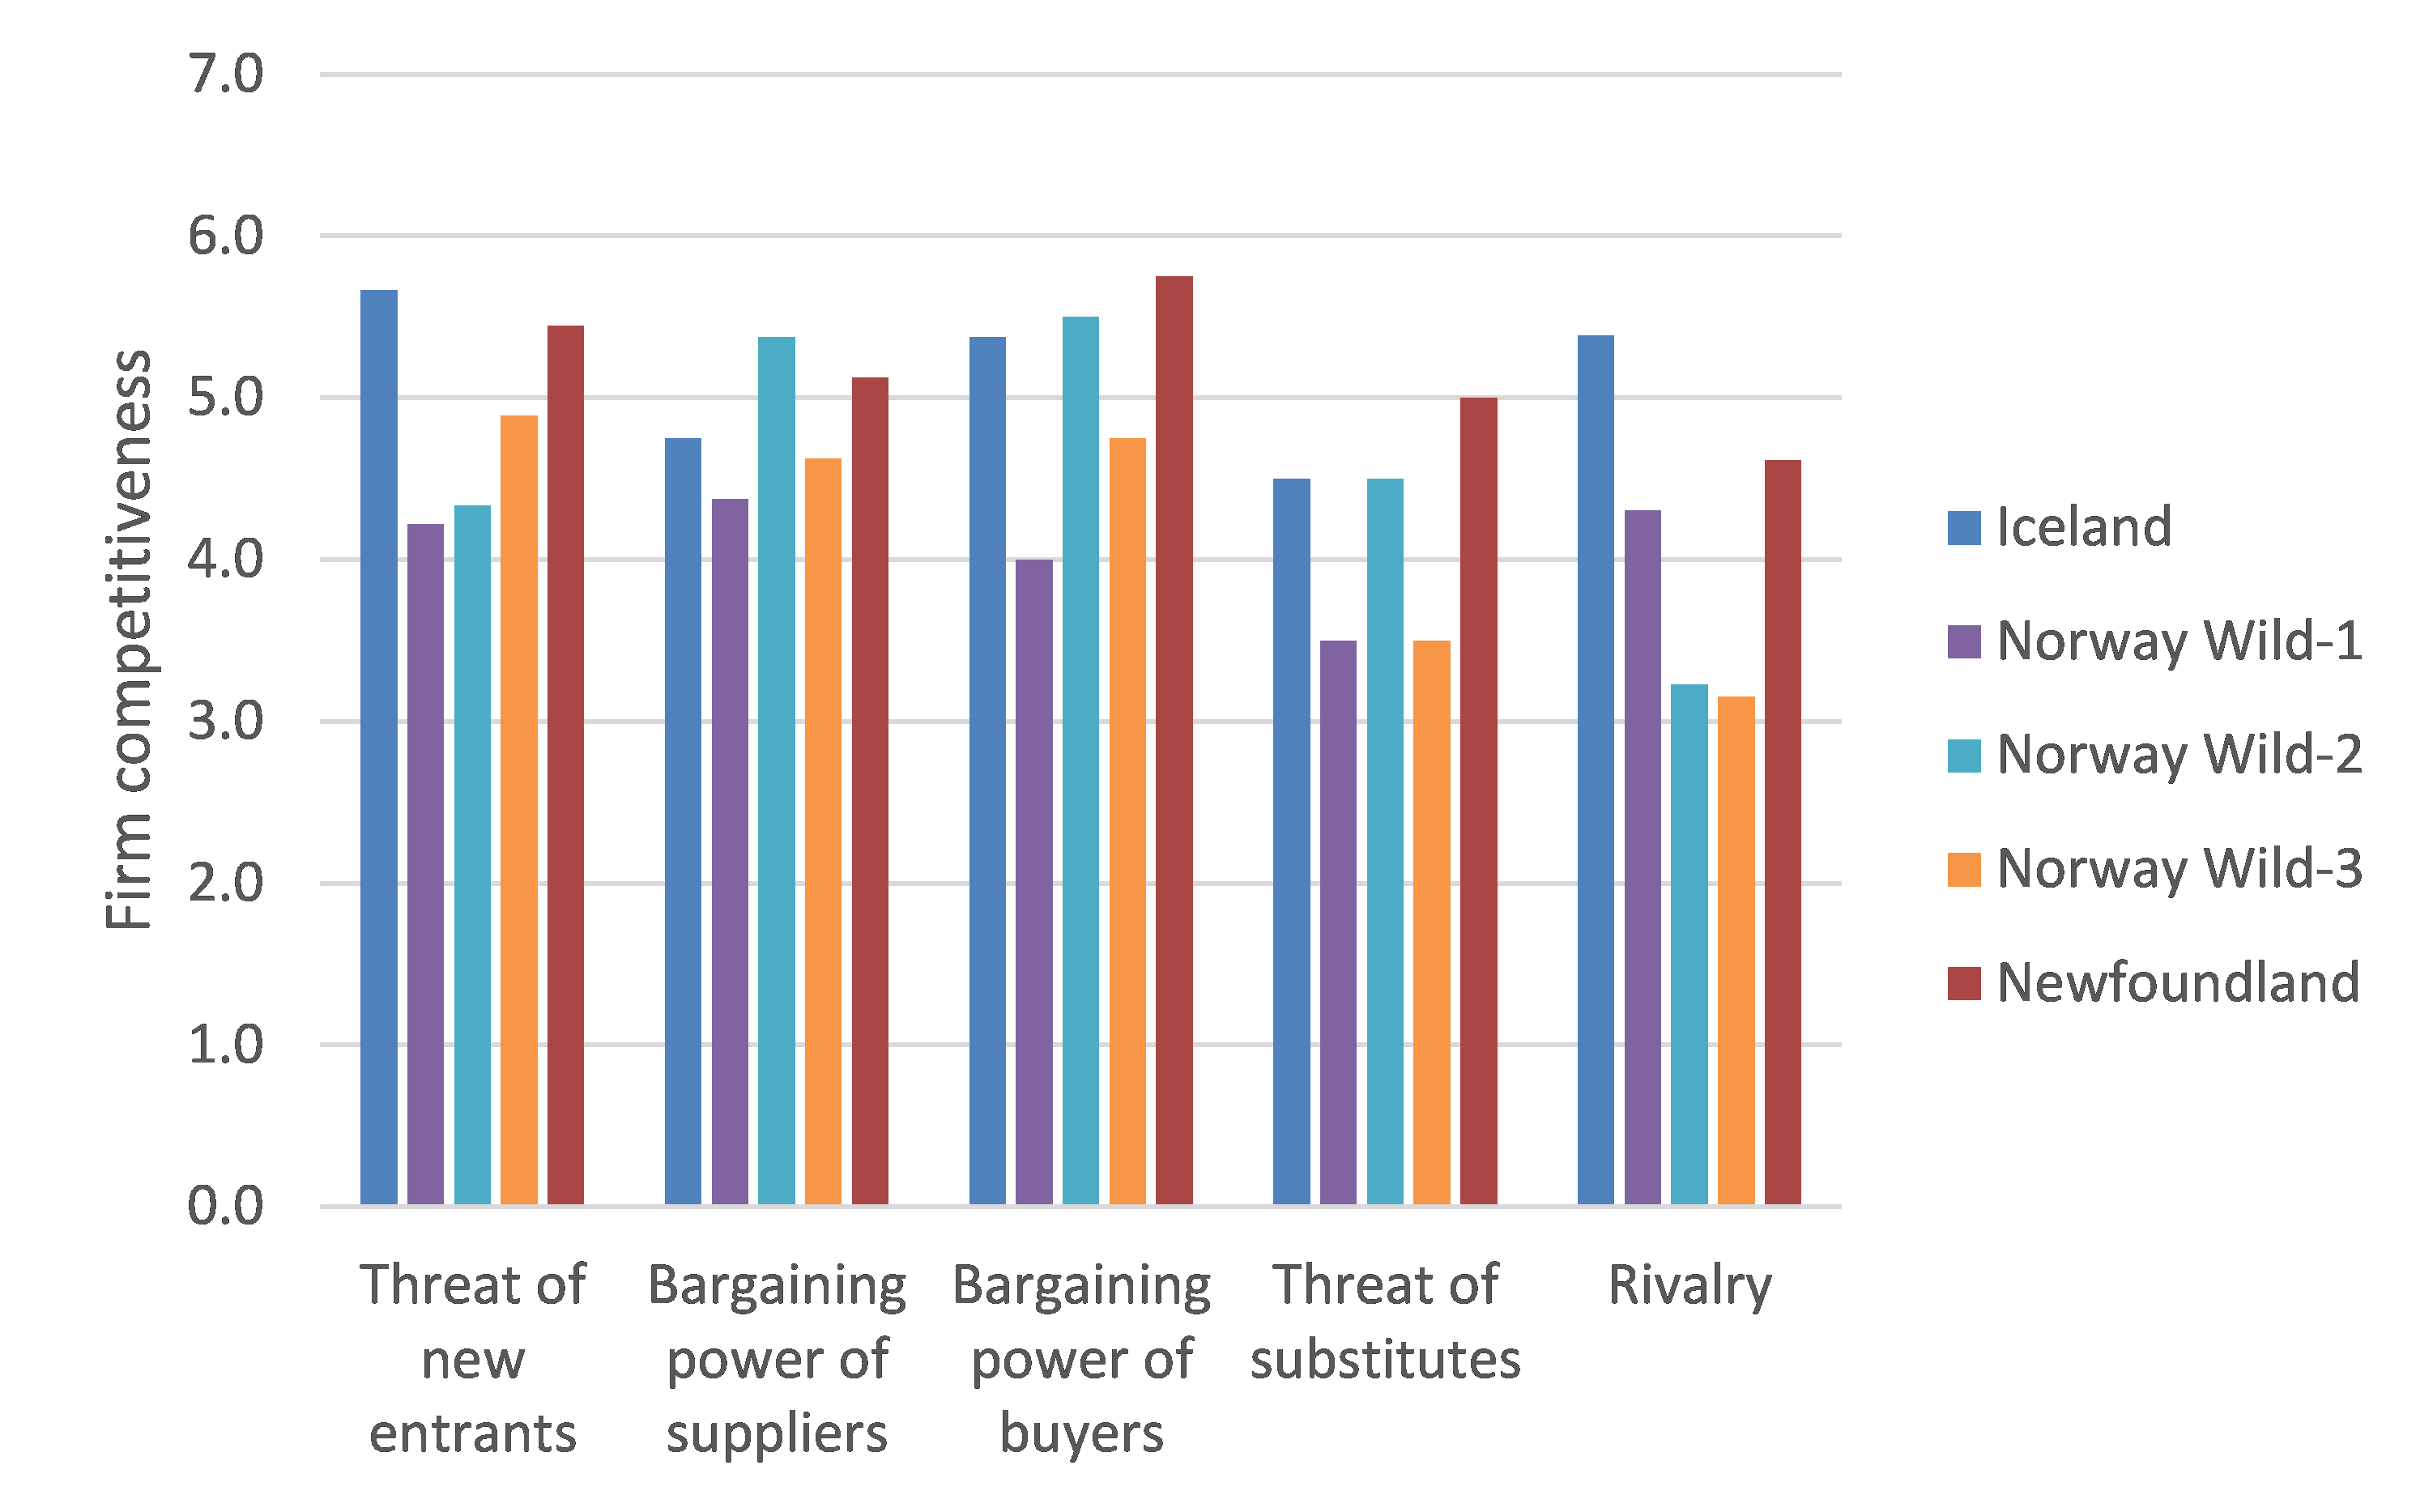
| 02:04, 6 February 2018 | Cpa figure5.png (file) |  |
194 KB | Figure 5 First level of aggregation – firm level competitiveness | 1 |
| 02:01, 6 February 2018 | Cpa figure4.png (file) |  |
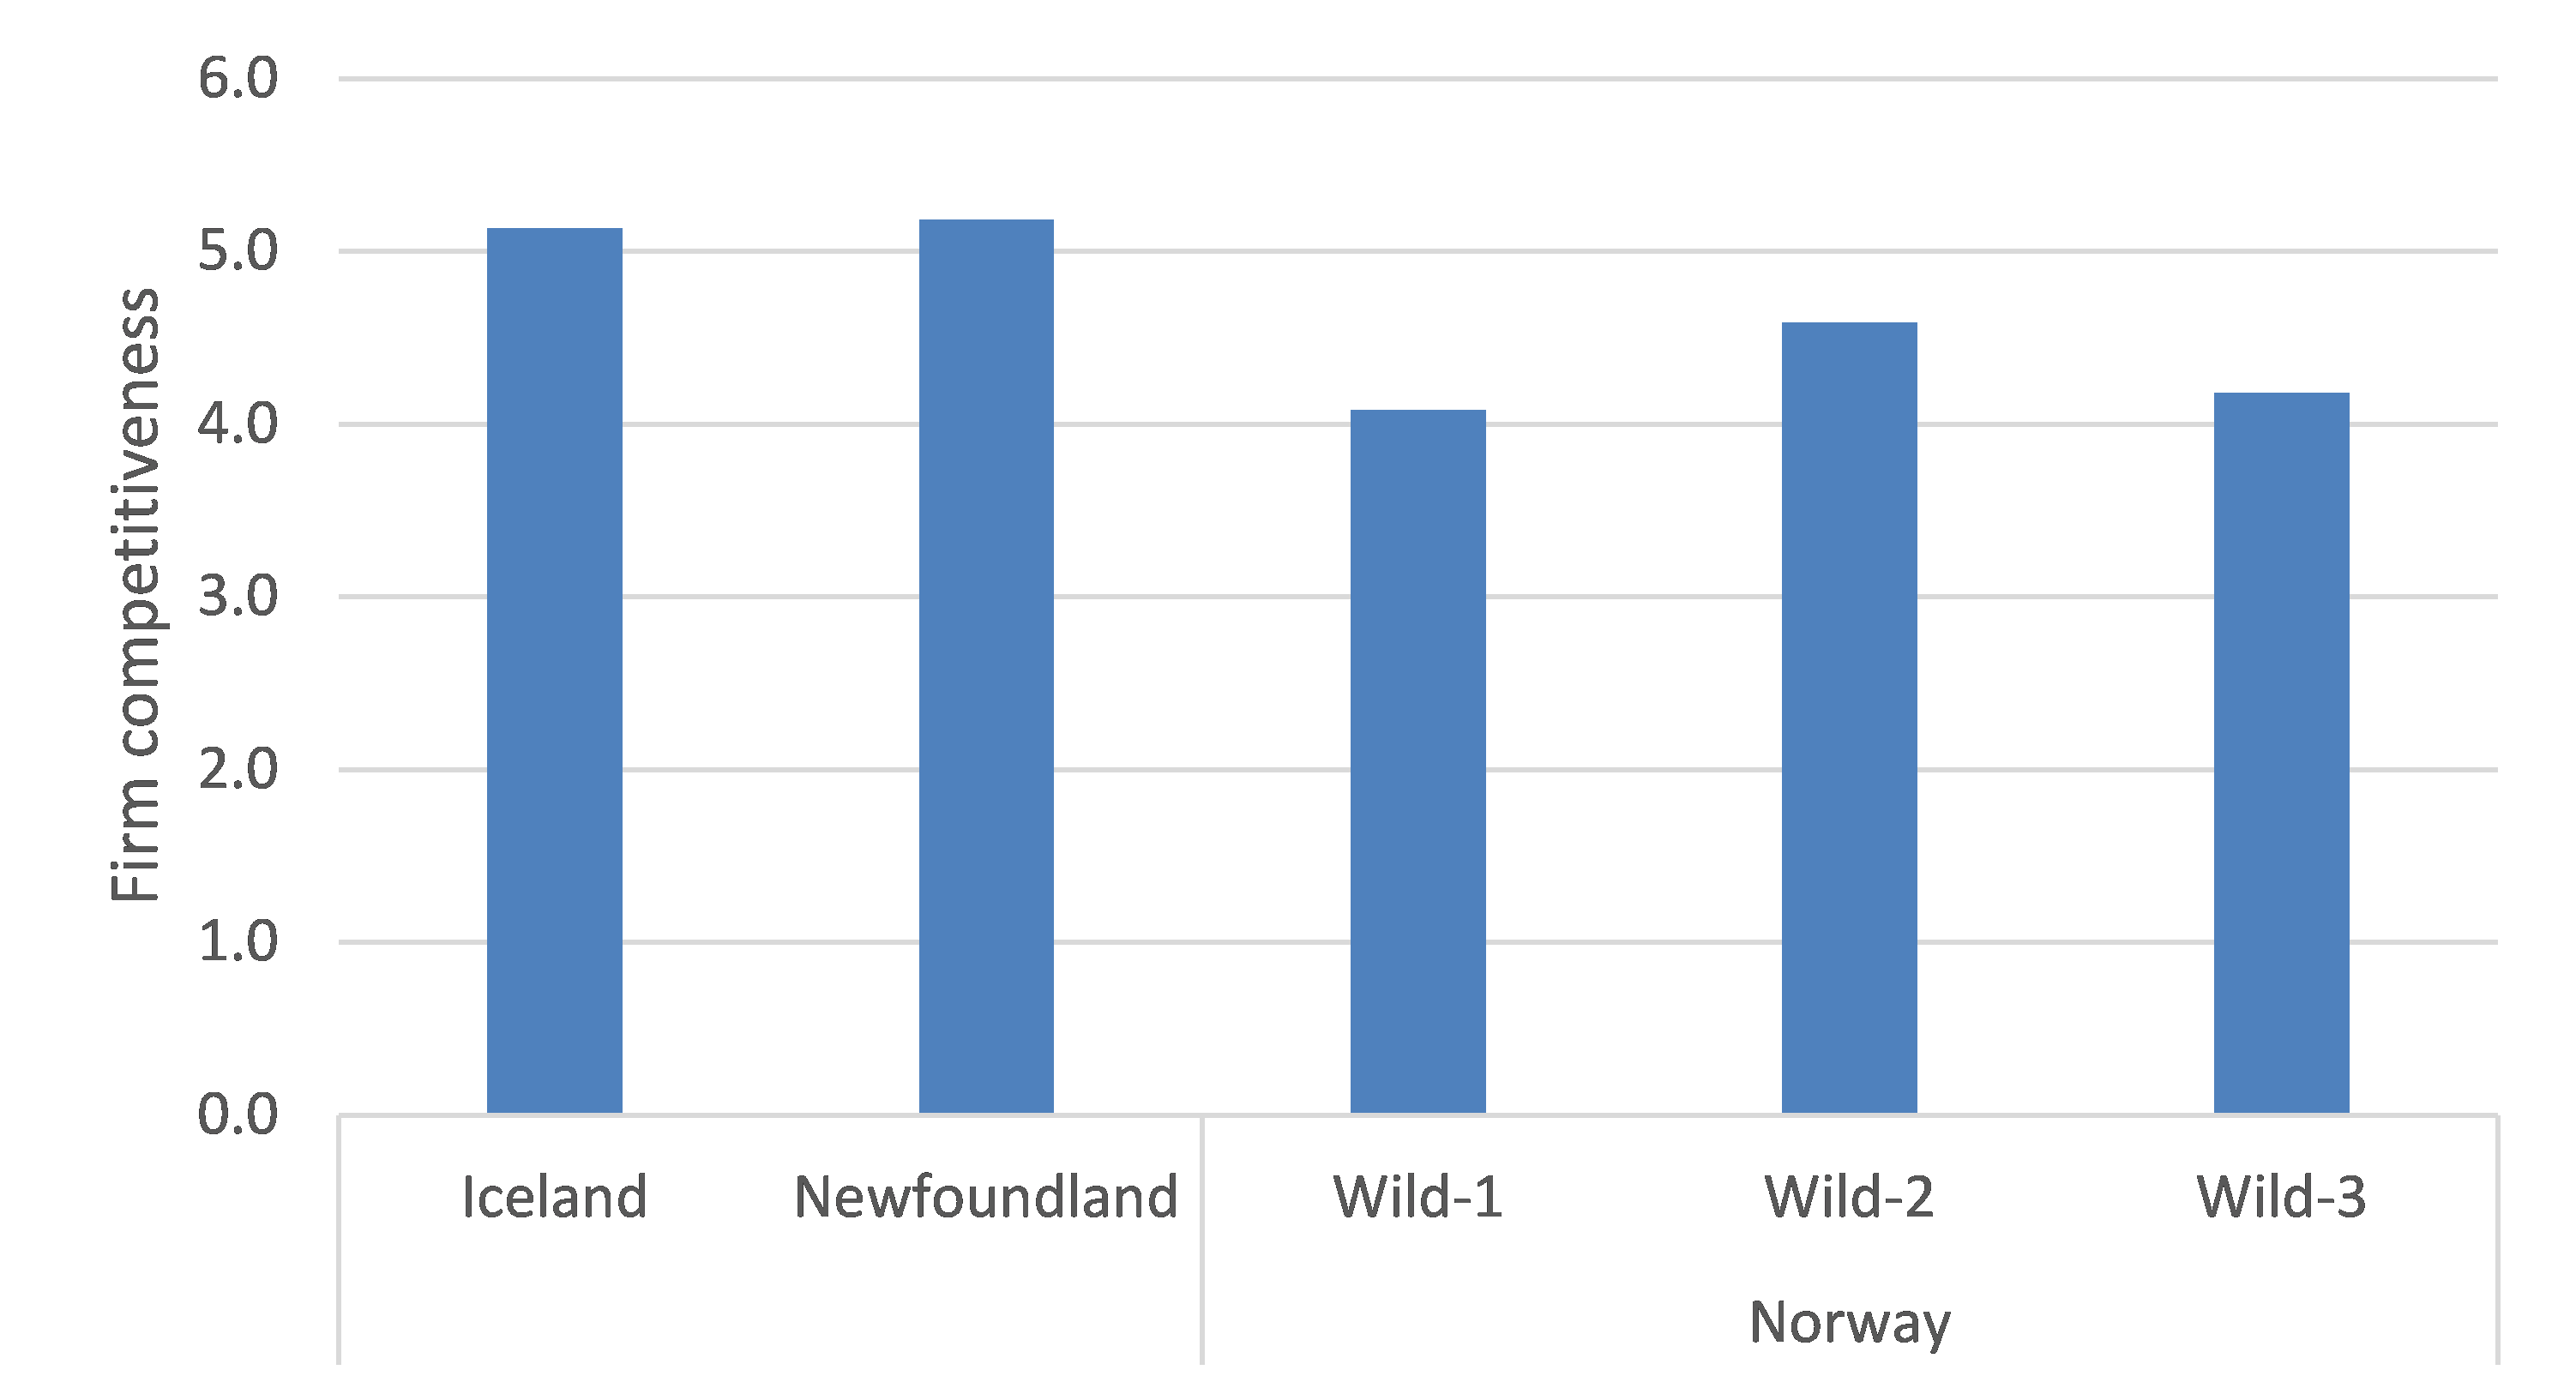
80 KB | Figure 4 - CPA - Total competitiveness between sampled firms in the wild fish sector | 1 |
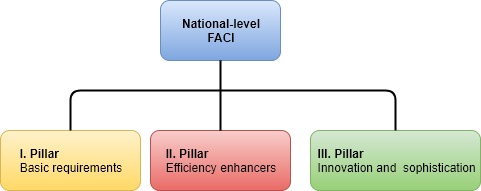
| 18:57, 4 February 2018 | NationalLevelFaci.jpg (file) |  |
15 KB | Overall structure of the national-level FACI. | 1 |
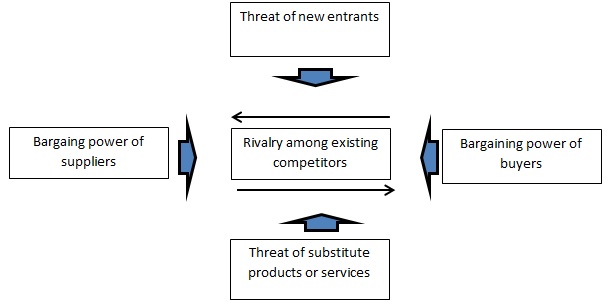
| 18:28, 4 February 2018 | FirmLevelFaci.jpg (file) |  |
31 KB | The five competitive forces that determine industry competition. Source: Porter (1998). | 1 |
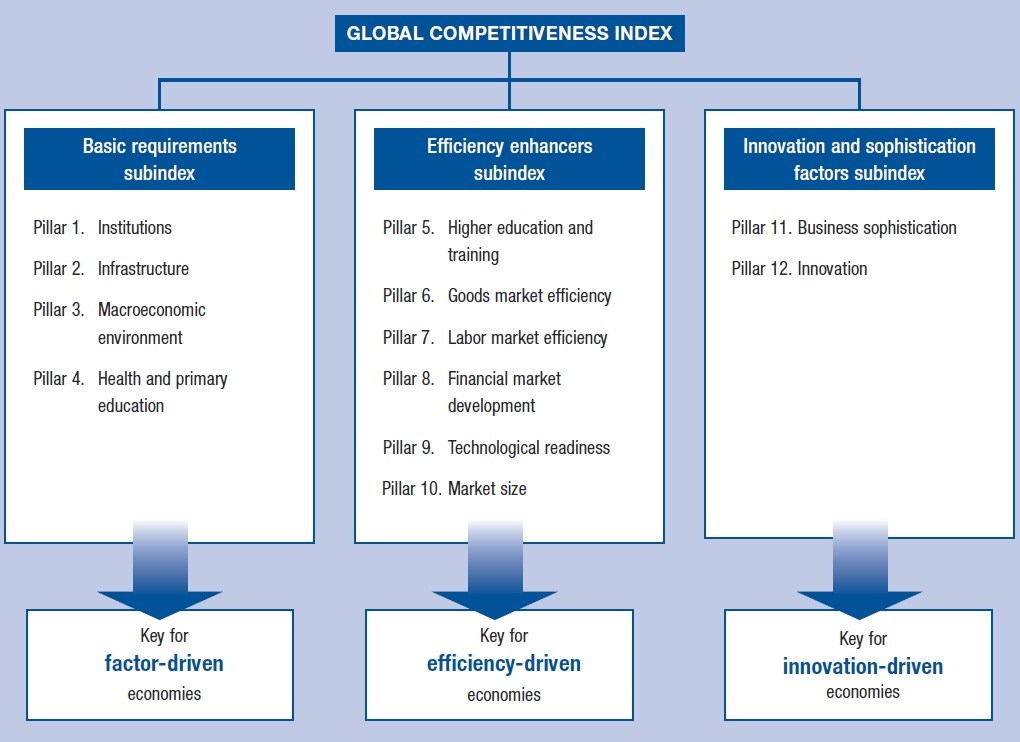
| 17:22, 4 February 2018 | Cpi structure.jpg (file) |  |
93 KB | The structure of the Global Competitiveness Index. Source: WEF 2016. | 1 |
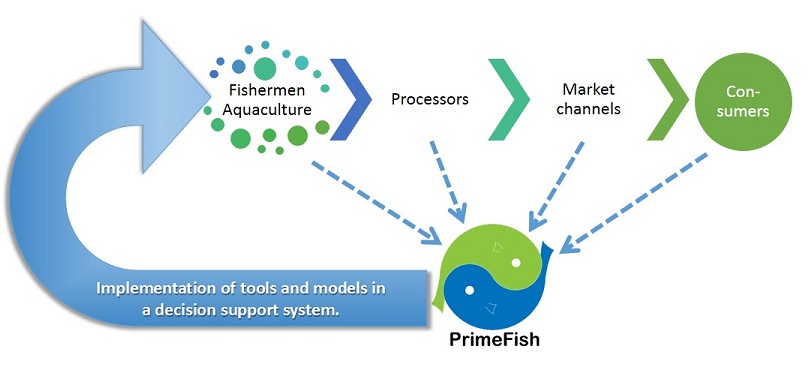
| 02:19, 17 October 2017 | Project primefish.jpg (file) |  |
56 KB | Project PrimeFish description | 1 |
First page |
Previous page |
Next page |
Last page |