WTP
Contents
Willingness to Pay
Introduction
The average apparent fish consumption per capita in the EU is the second highest in the world (at around 22 kg/capita/year), and some individual EU Member States are among the highest fish consuming countries in the world (EEA, 2016). The EU is the largest market in the world for fish; with a value of €55 billion and a volume of 12 million tons (FAO, 2016). While EU fish and seafood consumption has risen over the past 10 years with stable or declining supply from the fisheries sector, most of this increase has come from imports rather than from EU aquaculture. In 2014, around 75% of fisheries and aquaculture products consumed in the EU came from marine capture fisheries, which remains consistent with trends over the last decade (EUMOFA, 2015). Today 25% of all EU seafood consumption comes from EU fisheries, 10% from EU aquaculture and 65% from imports from third countries, both fisheries and aquaculture products. European aquaculture growth has stagnated since the turn of the century partly because its products have not been competitive compared with imports. In a market driven by the demand a better understanding of consumer purchasing behaviour towards fish products is paramount to developing more effective marketing and policy strategies (Carlucci et al., 2015). Therefore, understanding the consumers’ preferences across the EU countries for fish species and fish product attributes is crucial to sustain the fisheries and aquaculture sectors. The objective of this study was to investigate consumer demand and choice behaviour for fresh fish at the retail market. In particular, we examined consumer preferences for different fish alternative species, as well as different attributes. The outcomes allowed us to elicit consumers’ preferences and willingness to pay (WTP) for the salient attributes of a variety of fresh fish species in the retail market. We applied a discrete choice experiment (DCE) to accomplish this objective; this method is strongly consistent with the economic demand theory and in particular with the multi-attribute demand studies based on the Lancastrian consumer theory (Lancaster, 1966), This theory assumes that consumer’s utility stems from product properties rather than the products themselves. Thus, multi-attribute demand models can elicit the intrinsic value of the product attributes and have been applied widely in marketing research. Moreover, this method is highly flexible with respect to data collection and model specifications. DCE is based on random utility theory about individual decision making, and seems realistic in imitating real shopping behaviour (Louviere et al., 2000). Choice modelling techniques are multi-attribute valuation techniques that elicit values for multiple attributes by asking respondents to rate, rank or choose a set of attributes (levels). In particular, choice experiments are valuation techniques where respondents have to make trade-offs and indicate their preferred option out of a set of alternatives. We developed a choice-based on-line experiment, on a number of 500 respondents per country (Italy, France, Spain, UK and Germany). The profile attributes and levels analysed are derived from previous qualitative tasks (i.e., qualitative analysis by in-person interviews), and include product innovation features such as health claims, sustainability certification, etc. To accommodate the evaluation of choice alternatives through both attribute judgment and alternative comparison, we applied a labelled choice experiment (LCE), where choice alternatives were labelled by the respective names of the seafood (e.g., salmon, cod, herring, etc.) (Nguyen et al., 2015). We set our model specification in such a way that the constant terms, which represent intrinsic value of the alternatives, and attribute parameters were varied both over fish alternatives and across countries. The WTP associated with each attribute, by species and country, was also estimated.
Methods
We applied a labelled choice experiment (LCE) to investigate consumer demand and choice behaviour for fresh fish in a retail market hypothetical situation in five European countries: Italy, France, Spain, UK and Germany. The LCE was conducted for seven fish alternatives (i.e., cod, herring, seabass, seabream, salmon, trout and pangasius) labelled by the respective fish names. Consumer heterogeneity in preference was expressed by estimating a labelled latent class model with alternative-specific effects, which varies choice probability and model parameters over seafood alternatives and across classes. The WTP for extrinsic attributes (i.e., product format, production method, health claim, and sustainability certification), and the rank orderedintrinsic value are estimated for each seafood alternative within classes and the entire market. The WTP estimate in our study is expected to be more accurate than those derived from studies based on single product alternatives because the LCE allows respondents to evaluate choice alternatives through both attribute judgment and alternative comparison. Exploring a variety of product alternatives is also meaningful to firms with multiple products (e.g., fresh fish retailers) or firms with many direct competitors.
2.1 The choice experiment
The choice experiment was preceded by a cheap talk aiming at explaining the rationale behind the experiment and the need to respond carefully to the questions: “In this part of the questionnaire you will be asked to choose your preferred product from a set of 7 alternative products. Options A to G represent 7 different descriptions of a fish product. Please mark the displayed. Experience from previous similar surveys suggests that people often respond in one way but act in another. For instance, people sometimes state they would pay a higher price for a product than they actually would in reality. Therefore, please do consider thoroughly how the price would affect your budget, so that you are able to give as accurate an answer as possible. Similarly to the price, pay attentions to all fish alternatives and attributes“. At the end of the choice experiment, each consumer had to respond to the following questions in order to quantify the potential purchase: “What quantity would you purchase of the above product?“ Then, we have also asked consumers about their beliefs of health benefit claims and of the benefits of the sustainable certification to the environment and society, by answering the following questions: “In the marketplace, some producers provide health benefit information from consuming their products. On a scale of 0-100, to what extent do you believe such health benefit claims? (e.g., 0 = completely unbelievable; 50 = neutral; 100 = completely believable).“ “We assume you have read the definition of sustainability certification above. On a scale of 0-100, to what extent do you believe in the benefits of such certification to the environment and society? (e.g., 0 = completely unbelievable; 50 = neutral; 100 = completely believable).“
2.2 Attributes and levels
A previous qualitative study was performed with 30 individual in-depth interviews conducted in five countries identifying the positive or negative motives, perceptions, associations, attitudes towards fish/seafood consumption, with a focus on the chosen species: salmon, trout, seabass/seabream, herring and cod (Task 4.2). The findings of this qualitative work were collected considering the main attributes, barriers and format used by consumers for fish in general and for the selected fish species. These findings were summarized in Table A1 (see Appendix). This table 1 has been used to identify the main attributes that were mentioned quite uniformly across all fish species. Therefore, the following attributes were evaluated for all the different fish species:
- production method (farmed / wild caught)
- origin (specific countries to be agreed specie by specie)
- nutritional and health claims (high in omega-3, source of omega-3, etc.)
- date of catch / harvest (as a proxy of freshness)
Other attributes were instead relevant for specific fish species:
- format (fillet, whole, frozen, etc.)
- preparation (processed, “ovenable tray”, etc.)
- sustainability (MSC, organic, etc.)
- traceability
This preliminary set of attributes was represented in Table A22 (see Appendix), including: price, origin, production method, format, preparation, sustainability, health / nutrition claim and freshness. This list was discussed in the WP4 meeting in Paris (January 2017). From the discussion, we agreed to simplify the design, suggesting to concentrate the experiment on a more limited, and manageable, set of attributes and levels. Therefore, the final experimental design consisted in five attributes, defined for the seven fish alternatives: price, production method, format, sustainability certification, nutrition and health claim (Table 1). Table 2 provides the complete list specific for each fish species.
Table 1. Attributes and levels for the choice experiment in the five countries and for the seven fish species (trout, herring, salmon, sea bass, sea bream, cod and pangasius).
| Attributes | Levels |
|---|---|
| Price |
|
| Production method |
|
| Format (picture) |
|
| Sustainability certification |
|
| Nutrition and Health claim |
|
- Round cut for salmon and pangasius
Table 2: Final list of attributes and levels by fish species, common in the five countries.
| Attributes | Trout | Herring | Salmon | Sea bass | Sea bream | Cod | Pangasius |
|---|---|---|---|---|---|---|---|
| Price |
|
|
|
|
|
|
|
| Production method |
Farm-raised fish |
Wild-caught fish |
|
|
|
|
Farm-raised fish |
| Format (picture) |
|
|
|
|
|
|
|
| Sustainability certification |
|
|
|
|
|
|
|
| Nutritional and Health claim |
|
|
|
|
|
|
|
* Product high of omega 3 fatty acids which contributes to maintenance of normal function of the heart and normal blood pressure (the beneficial effect is obtained with a daily intake of 250 mg of omega 3 fatty acids. Such amount can be consumed as part of a balanced diet).
For the definition of the attribute price, we have provided some indication by email3 to the reference project partners for each country, suggesting to have, as much as possible, an yearly average market price level (at the retail stage) from an official data source (e.g., governmental/Ministry agencies, like ISMEA in Italy, etc.), possibly for year 2016. The price was indicated in €/kg potentially paid by consumers (£/kg in the UK), more detailed as possible (also with decimals), and considered for the average product/format (fresh product). If the data was not retrieved data from official source, we suggested to search it from other renowned sources (e.g., producers associations or syndicates, or the industry reference group), or from other sources (e.g., grey literature). The last possibility suggested was to perform a shop check to get the missing price(s); in this case, we have suggested to visit multiple shops of different format (large retailers, fishmongers, etc.), and calculate an average price. We have also suggested, if possible, to get the data also different geographical locations. For practical purposes, we have provided a table with some price levels downloaded by http://www.eumofa.eu/. The average prices, with corresponding levels +/- 30%, are reported in Table 3.
The production method attribute (wild / farmed) is usually considered relevant in purchasing decision, where wild fish is generally perceived as being superior to farmed fish by the majority of consumers in terms of taste, safety, healthiness and nutritional value (Carlucci et al., 2015). However, consumers’ perception of farmed fish is also positive for popular cultivated species, such as seabass, seabream, trout and salmon. Considering these patterns, we have decided to include the production method in the experimental design. The format attribute was presented as a picture to consumers. The pictures has been done by a professional agency based on our suggestions. The first shots have been commented by the partners, and several modifications have been suggested, in particular for the ready-tocook level. The final set of pictures, specific by fish species and country, is reported in Table A3 (see Appendix).
The sustainability certification attribute was based on the following definition, provided to respondents before the choice experiment, mostly derived from the Marine Stewardship Council (MSC) and Aquaculture Stewardship Council (ASC) standards:When certified according to a sustainability scheme, any fish can be traced back to a fishery or to a fish farm that meets principles reflecting the maintenance and re-establishment of healthy populations of targeted species, the maintenance of the integrity of ecosystems, the use of feed and other inputs that are sourced responsibly, and the social responsibility for workers and communities impacted by fishing and fish farming. This standard is intended to be used on a global basis by accredited third party certifiers to undertake the certification of fisheries and fish farmers to the above mentioned principles and criteria
The nutrition and health claim used in the experiment is “Product high of omega 3 fatty acids which contributes to maintenance of normal function of the heart and normal blood pressure”, with the following condition of use: “the beneficial effect is obtained with a daily intake of 250 mg of omega 3 fatty acids. Such amount can be consumed as part of a balanced diet”. This claim has already been approved by the EFSA (2009; 2010).
Table 3: Price levels (€/kg, and £/kg for the UK) by fish species for each country
| Trout | Herring | Salmon | Seabream | Seabass | Cod | Pangasius | |
|---|---|---|---|---|---|---|---|
| France | |||||||
| Price + 30% | 16.64 | 12.87 | 19.37 | 14.95 | 18.59 | 19.37 | 11.05 |
| Avg. price | 12.80 | 9.90 | 14.90 | 11.50 | 14.30 | 14.90 | 8.50 |
| Price -30% | 8.96 | 6.93 | 10.43 | 8.05 | 10.01 | 10.43 | 5.95 |
| Spain | |||||||
| Price + 30% | 7.76 | 15.47 | 16.73 | 12.83 | 14.35 | 15.60 | 6.80 |
| Avg. price | 5.97 | 11.90 | 12.87 | 9.87 | 11.04 | 12.00 | 5.23 |
| Price -30% | 4.18 | 8.33 | 9.01 | 6.91 | 7.73 | 8.40 | 3.66 |
| Italy | |||||||
| Price + 30% | 13.66 | 12.87 | 19.63 | 14.07 | 15.37 | 15.87 | 7.28 |
| Avg. price | 10.51 | 9.90 | 15.10 | 10.82 | 11.82 | 12.21 | 5.60 |
| Price -30% | 7.36 | 6.93 | 10.57 | 7.57 | 8.27 | 8.55 | 3.92 |
| Germany | |||||||
| Price + 30% | 15.05 | 14.12 | 21.89 | 21.71 | 21.84 | 21.78 | 6.83 |
| Avg. price | 11.58 | 10.86 | 16.84 | 16.70 | 16.80 | 16.75 | 5.25 |
| Price -30% | 8.11 | 7.60 | 11.79 | 11.69 | 11.76 | 11.73 | 3.68 |
| UK (€/kg) | |||||||
| Price + 30% | 21.83 | 6.81 | 20.97 | 28.09 | 30.73 | 20.68 | 13.48 |
| Avg. price | 16.79 | 5.24 | 16.13 | 21.61 | 23.64 | 15.91 | 10.37 |
| Price -30% | 11.75 | 3.67 | 11.29 | 15.13 | 16.55 | 11.14 | 7.26 |
| UK (£/kg) | |||||||
| Price + 30% | 19.32 | 6.03 | 18.56 | 24.86 | 27.20 | 18.30 | 11.93 |
| Avg. price | 14.86 | 4.64 | 14.27 | 19.12 | 20.92 | 14.08 | 9.18 |
| Price -30% | 10.40 | 3.25 | 9.99 | 13.39 | 14.64 | 9.86 | 6.42 |
We have decided to exclude the attribute origin; indeed, this attribute has already been deeply studied in the literature (Carlucci et al., 2015). Moreover, a huge effect of the domestic origin has been documented: 145% WTP by Stefani et al. (2012), 108% by Mauracher et al. (2013), 100% by McClenachan et al. (2016). We have evaluated that this effect might overwhelm the impact of other attributes on the consumers’ choices. Therefore, since other attributes have been studied much less, we have preferred to exclude the origin from the experiment.
2.3 Measures
Apart the choice experiment, the questionnaire included the following items: sociodemographics, frequency of consumption of fish, past consumption, level of responsibility in fish purchasing and cooking, fish choice motives, attitude towards environmental concerns, attitude towards health concerns, self-efficacy, trust, and attitude towards ready-to-cook fish. The survey questionnaire was developed and revised based on input from qualitative analysis and pre-tests. The questionnaire has been submitted online and was approx. 15 minutes long. The items with the asterisk (*) are common “bridge questions” with the survey performed in Task 5.4. The English version of the questionnaire is reported in the Appendix (see Appendix A4); the partners have translated the English version of the questionnaire in their national language (i.e. Italian, French, German and Spanish). Their versions were checked using a back-translation method to avoid semantic variance between countries.
The frequency of consumption of fish was measured by the following item: “Please indicate how often you consume fish (fresh, frozen, canned, smoked, ready to eat, etc.) at home, at restaurants and other food outlets (canteens, bars, etc.): Almost every day; 3-4 times a week; 1 or 2 times a week; 2-3 times a month; Once a month or less; Few times a year; Never” (*). This question has been replicated for every species considered in the experiment (salmon, trout, seabass, seabream, herring, cod, and pangasius). Past consumption was assessed by the following 7-point scaled item: “In the past 3 years has your fish consumption: strongly decreased – strongly increased” (*).
We have assessed the level of responsibility in fish purchasing and cooking by asking respondents to indicate the level of involvement in their household in fish purchasing, and in preparing and cooking fish (Not at all involved/Somewhat involved/Fairly involved/Completely involved).
Then we asked respondents to indicate the importance of each of the following attributes when purchasing fish: general appearance (*), free of smell (*), value for money (*), sustainability certification (*), easy to cook (*), low in calories (*), not previously frozen, wild caught, domestic origin, days since catch/harvest, organic certification, price (fish choice motives).
Attitude towards environmental concerns was assessed with two items (7-point scale, from ‘‘strongly disagree” to ‘‘strongly agree”): “I believe that fishing has negative consequences on marine resources” (*), “I believe that fish farming has negative consequences on the environment” (*).
We have measured attitude towards health concerns with two items (7-point scale, from ‘‘strongly disagree” to ‘‘strongly agree”): “I believe that eating fish containing omega-3 fatty acids benefits my health” (*), “I believe that eating fish would expose myself to substances (e.g. mercury, antibiotics, etc.) risking negative consequences on my health” (*).
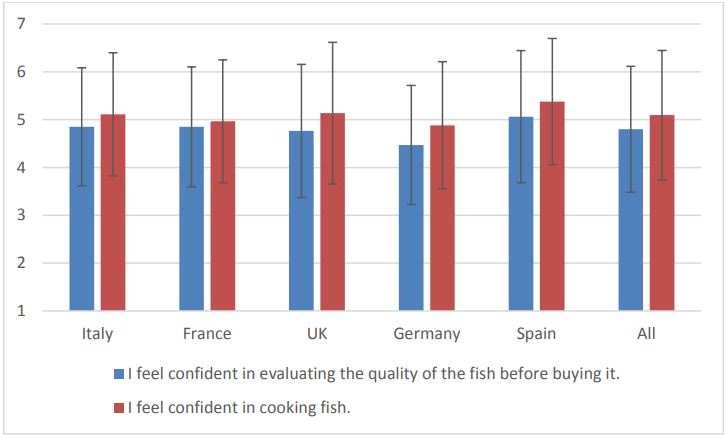
We assessed self-efficacy with two items, using a 7-point scale (from ‘‘strongly disagree” to ‘‘strongly agree”): “I feel confident in evaluating the quality of the fish before buying it” (*), “I feel confident in cooking fish” (*).
Trust was defined by asking respondents the level of agreement (using a 7-point scale, from ‘‘strongly disagree” to ‘‘strongly agree”) with the following five statements: “I would trust the information provided about the sustainable fish production practices (fishing or farming) if they were certified by a: Public authority (e.g., the national Government or the EU) / Fish farmer or fisherman / Fish processing industry / Retailer / Independent organization (e.g., an NGO)”.
Attitude towards ready-to-cook fish was measured with four items using a 7-point scale (from ‘‘strongly disagree” to ‘‘strongly agree”): “I believe that ready-to-cook products would alter the original fish characteristics” (*), “I prefer to eat ready-to-cook fish because it allows me to save time” (*), “Preferably, I spend as little time as possible on meal preparation” (*), and “I prefer to eat ready-to-cook fish because it does not smell”.
2.4 Data collection and sample
Data for this study were collected in June 2017 through a nationwide online survey administered in the five countries (Italy, France, Spain, UK and Germany) by a third-party contractor using its consumer panel database. The sample in each country consisted of approximately 500 fish consumers (2,509 in total), representative of the national populations in at least three of the following criteria: age, gender, educational level and geographical macro-areas (e.g. in Italy: North, Centre, South). The main sample characteristics are reported in Table 4.
Table 4: Sample characteristics.
| France | Germany | Italy | Spain | UK | Total | |||||||
|---|---|---|---|---|---|---|---|---|---|---|---|---|
| Gender | n | % | n | % | n | % | n | % | n | % | n | % |
| Males | 256 | 51.1% | 262 | 52.2% | 250 | 49.6% | 260 | 51.9% | 254 | 50.7% | 1282 | 51.1% |
| Females | 245 | 48.9% | 240 | 47.8% | 254 | 50.4% | 241 | 48.1% | 247 | 49.3% | 1227 | 48.9% |
| Age | n | % | n | % | n | % | n | % | n | % | n | % |
| 18-24 | 61 | 12.2% | 56 | 11.2% | 51 | 10.1% | 56 | 11.2% | 49 | 9.8% | 273 | 10.9% |
| 25-34 | 91 | 18.2% | 101 | 20.1% | 98 | 19.4% | 97 | 19.4% | 121 | 24.2% | 508 | 20.2% |
| 35-44 | 113 | 22.6% | 99 | 19.7% | 117 | 23.2% | 132 | 26.3% | 105 | 21.0% | 566 | 22.6% |
| 45-54 | 117 | 23.4% | 130 | 25.9% | 127 | 25.2% | 114 | 22.8% | 118 | 23.6% | 606 | 24.2% |
| 55+ | 119 | 23.8% | 116 | 23.1% | 111 | 22.0% | 102 | 20.4% | 108 | 21.6% | 556 | 22.2% |
| Education | n | % | n | % | n | % | n | % | n | % | n | % |
| Lower secondary education or below | 92 | 18.4% | 86 | 17.1% | 197 | 39.1% | 181 | 36.1% | 79 | 15.8% | 635 | 25.3% |
| Upper secondary education | 140 | 27.9% | 97 | 19.3% | 156 | 31.0% | 65 | 13.0% | 149 | 29.7% | 607 | 24.2% |
| University or college below a degree | 97 | 19.4% | 191 | 38.0% | 68 | 13.5% | 75 | 15.0% | 71 | 14.2% | 502 | 20.0% |
| Bachelor's or equivalent level | 88 | 17.6% | 58 | 11.6% | 41 | 8.1% | 116 | 23.2% | 133 | 26.5% | 436 | 17.4% |
| Postgraduate MSc or PhD | 84 | 16.8% | 70 | 13.9% | 42 | 8.3% | 64 | 12.8% | 69 | 13.8% | 329 | 13.1% |
| Geographical area | n | % | n | % | n | % | n | % | n | % | n | % |
| Rural area | 164 | 32.7% | 100 | 19.9% | 93 | 18.5% | 52 | 10.4% | 113 | 22.6% | 522 | 20.8% |
| Small sized urban area | 170 | 33.9% | 187 | 37.3% | 208 | 41.3% | 144 | 28.7% | 180 | 35.9% | 889 | 35.4% |
| Large urban area | 167 | 33.3% | 215 | 42.8% | 203 | 40.3% | 305 | 60.9% | 208 | 41.5% | 1098 | 43.8% |
| Coastline | n | % | n | % | n | % | n | % | n | % | n | % |
| Yes | 160 | 31.9% | 91 | 18.1% | 215 | 42.7% | 294 | 58.7% | 184 | 36.7% | 944 | 37.6% |
| mean | sd | mean | sd | mean | sd | mean | sd | mean | sd | mean | sd | |
| BMI | 25.2 | 5.6 | 26.8 | 6.9 | 25.2 | 5.2 | 25.5 | 4.8 | 31.2 | 15.5 | 26.8 | 8.9 |
| Persons in household (n) | 2.6 | 1.3 | 2.4 | 1.2 | 3.0 | 1.2 | 3.2 | 1.2 | 2.8 | 1.6 | 2.8 | 1.3 |
| < 18 years (n) | 0.7 | 1.0 | 0.4 | 0.7 | 0.6 | 0.8 | 0.8 | 0.9 | 0.7 | 1.2 | 0.6 | 1.0 |
| > 60 years (n) | 0.4 | 0.7 | 0.4 | 0.7 | 0.5 | 0.8 | 0.4 | 0.7 | 0.3 | 0.7 | 0.4 | 0.7 |
| Total (n) | 501 | 502 | 504 | 501 | 501 | 2509 | ||||||
2.5 The experimental design
The experimental design resulted in 9 blocks of 8 choice sets with 7 product profiles plus the “no choice” option. Figure 1 shows an example of the layout of the choice set.
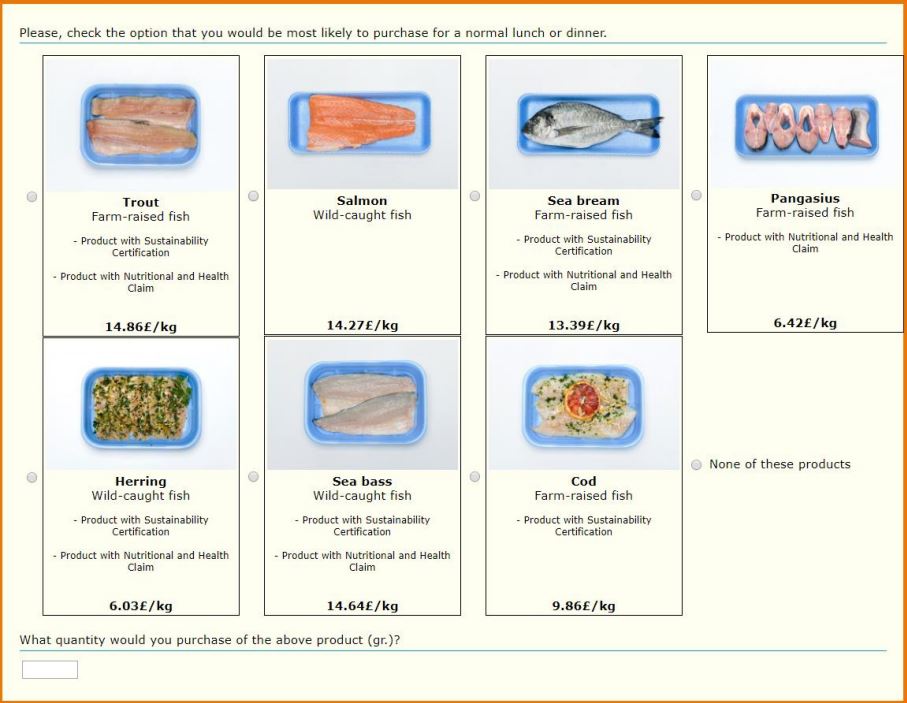 Figure 1: Example of choice set.
Models
3.1 Descriptive analysis
The median values of fish consumption is reported in Table 5. In our samples, fish is more frequently consumed in Italy, France and Spain: ‘‘3-4 times a week” as a median value. As a median value, pangasius, herring and trout are the fish species less consumed in every country, whilst cod and salmon are those more consumed. Seabass and seabream are frequently consumed in the Mediterranean countries (Italy and Spain, in particular).
Table 5: Frequency of fish consumption (median values).
| Italy | France | Germany | Spain | UK | |
|---|---|---|---|---|---|
| Trout | Few times a year | Few times a year | Few times a year | Few times a year | Few times a year |
| Herring | Few times a year | Few times a year | Few times a year | Few times a year | Never |
| Salmon | Once a month | Once a month | Once a month | Once a month | Once a month |
| Seabass | Once a month | Few times a year | Never | Once a month | Few times a year |
| Seabream | Once a month | Few times a year | Never | Once a month | Never |
| Cod | 2-3 times a month | Once a month | 2-3 times a month | 2-3 times a month | 2-3 times a month |
| Pangasius | Few times a year | Never | Few times a year | Few times a year | Never |
| Fish | 3-4 times a week | 3-4 times a week | 2-3 times a week | 3-4 times a week | 2-3 times a week |
Overall, 40% of the respondents increased fish consumption in the past 3 years, 16% decreased fish consumption in the same period, and 44% maintained the same level. The share of those who increased fish consumption is higher in the UK (45%) and Italy (43%), whilst the quota of those who decreased fish consumption is higher in France (20%), Germany (17%) and Spain (17%) (Figure 2).
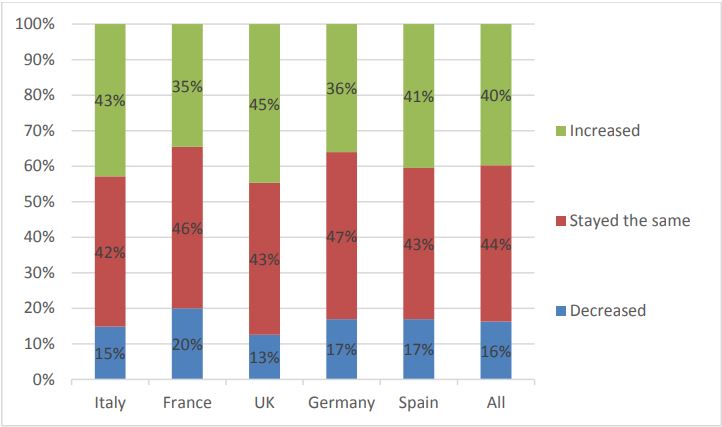 Figure 2: Evolution of fish consumption in the past 3 years.
The level of involvement is high in all countries both for fish purchasing (83% are completely or fairly involved) and for fish preparing and cooking (79%). The level of involvement is higher in the UK, respectively, 86% and 84% (Figure 3).
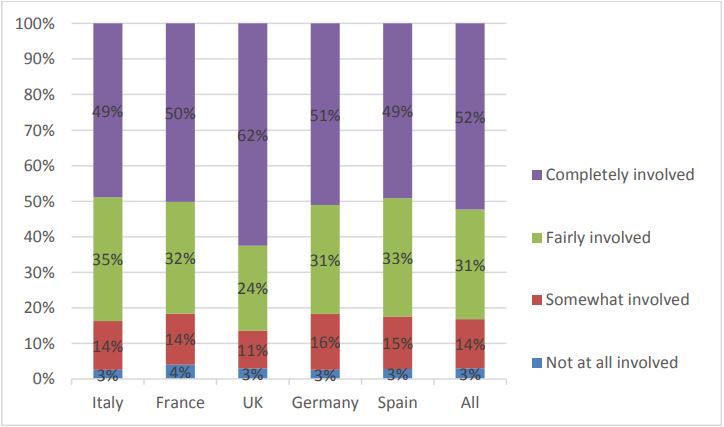 Figure 3: Level of involvement in fish purchasing in your household.
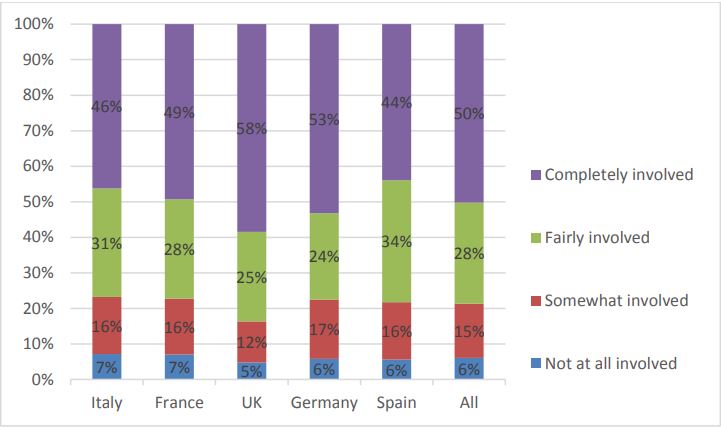 Figure 4: Level of involvement in your household when preparing and cooking fish.
Table 6 shows the fish choice motives expressed by the participants. Value for money, price and general appearance are the most important attributes in every country. However, in Italy wild caught and days since catch/harvest (likely as a proxi of freshness) are more important than price. Easy to cook is ranked as another important attribute in fish selection, in particular in France, UK and Germany. Sustainability certification is ranked as 5th and 6th aspect in fish selection, respectively, in Germany and Spain. Table 7 shows the level of agreement on the attitudinal beliefs attitude towards environmental concerns (AE), attitude towards health concerns (AH), self-efficacy (SE), trust in information about sustainable production (TI), attitude towards ready-to-cook fish (AR). The results about the attitudinal beliefs are also displayed in Figures 5-9.
Table 6: Relative importance of different aspects in fish selection (1 = Not at all important; 7 = Extremely important).
| France | Germany | Italy | Spain | UK | Total | |||||||
|---|---|---|---|---|---|---|---|---|---|---|---|---|
| Fish choice motives | Mean | sd | Mean | sd | Mean | sd | Mean | sd | Mean | sd | Mean | sd |
| Value for money | 5.63 | 1.24 | 5.15 | 1.39 | 5.61 | 1.17 | 5.62 | 1.27 | 5.33 | 1.42 | 5.47 | 1.31 |
| Price | 5.57 | 1.24 | 5.10 | 1.34 | 5.31 | 1.25 | 5.44 | 1.29 | 5.29 | 1.42 | 5.34 | 1.32 |
| General appearance | 5.43 | 1.49 | 5.19 | 1.48 | 5.66 | 1.38 | 5.38 | 1.47 | 5.01 | 1.65 | 5.33 | 1.51 |
| Free of smell | 4.81 | 1.64 | 4.77 | 1.64 | 5.17 | 1.48 | 5.34 | 1.49 | 4.90 | 1.76 | 5.00 | 1.62 |
| Easy to cook | 5.09 | 1.44 | 4.87 | 1.49 | 4.99 | 1.35 | 4.97 | 1.44 | 5.00 | 1.49 | 4.98 | 1.44 |
| Days since catch/harvest | 5.01 | 1.51 | 4.39 | 1.63 | 5.36 | 1.43 | 5.25 | 1.46 | 4.70 | 1.67 | 4.94 | 1.58 |
| Sustainability certification | 4.80 | 1.48 | 4.81 | 1.59 | 5.14 | 1.36 | 5.09 | 1.45 | 4.65 | 1.72 | 4.90 | 1.54 |
| Domestic origin | 5.01 | 1.47 | 4.13 | 1.57 | 5.26 | 1.42 | 4.97 | 1.49 | 4.35 | 1.68 | 4.74 | 1.59 |
| Wild caught | 4.77 | 1.44 | 4.01 | 1.47 | 5.39 | 1.34 | 4.74 | 1.49 | 4.33 | 1.64 | 4.65 | 1.55 |
| Organic certification | 4.60 | 1.45 | 4.04 | 1.69 | 4.94 | 1.45 | 5.00 | 1.47 | 3.92 | 1.77 | 4.50 | 1.64 |
| Not previously frozen | 4.54 | 1.61 | 3.88 | 1.55 | 5.11 | 1.54 | 4.81 | 1.58 | 4.16 | 1.70 | 4.50 | 1.66 |
| Low in calories | 4.28 | 1.61 | 3.89 | 1.65 | 4.45 | 1.61 | 4.62 | 1.50 | 4.16 | 1.77 | 4.28 | 1.65 |
Table 7: Level of agreement on the following attitudinal beliefs: attitude towards environmental concerns (AE), attitude towards health concerns (AH), self-efficacy (SE), trust in information about sustainable production (TI), attitude towards ready-to-cook fish (AR).
| France | Germany | Italy | Spain | UK | Total | ||||||||
|---|---|---|---|---|---|---|---|---|---|---|---|---|---|
| Fish choice motives | Att | Mean | sd | Mean | sd | Mean | sd | Mean | sd | Mean | sd | Mean | sd |
| I believe that fishing has negative consequences on marine resources. | AE | 4.73 | 1.43 | 4.39 | 1.41 | 4.02 | 1.53 | 4.39 | 1.52 | 4.27 | 1.41 | 4.36 | 1.48 |
| I believe that fish farming has negative consequences on the environment. | AE | 4.38 | 1.47 | 3.79 | 1.44 | 3.74 | 1.51 | 3.88 | 1.66 | 4.14 | 1.44 | 3.98 | 1.52 |
| I believe that eating fish containing omega-3 fatty acids benefits my health. | AH | 5.40 | 1.34 | 5.41 | 1.22 | 5.57 | 1.27 | 5.69 | 1.35 | 5.42 | 1.30 | 5.50 | 1.30 |
| I believe that eating fish would expose myself to substances (e.g. mercury, antibiotics, etc.) risking negative consequences on my health. | AH | 3.99 | 1.53 | 3.79 | 1.42 | 3.95 | 1.50 | 4.19 | 1.61 | 3.64 | 1.56 | 3.91 | 1.54 |
| I feel confident in evaluating the quality of the fish before buying it. | SE | 4.85 | 1.25 | 4.47 | 1.25 | 4.85 | 1.23 | 5.06 | 1.38 | 4.76 | 1.39 | 4.80 | 1.32 |
| I feel confident in cooking fish. | SE | 4.97 | 1.28 | 4.88 | 1.33 | 5.11 | 1.29 | 5.38 | 1.32 | 5.14 | 1.48 | 5.09 | 1.35 |
| I would trust the information provided about the sustainable fish production practices (fishing or farming) if they were certified by a public authority (e.g., the Government or the EU) | TI | 4.49 | 1.43 | 4.68 | 1.39 | 4.79 | 1.47 | 5.00 | 1.54 | 4.88 | 1.46 | 4.77 | 1.47 |
| I would trust the information provided about the sustainable fish production practices (fishing or farming) if they were certified by a fish farmer or fisherman | TI | 4.71 | 1.38 | 4.53 | 1.35 | 4.65 | 1.37 | 4.85 | 1.36 | 4.69 | 1.39 | 4.68 | 1.37 |
| I would trust the information provided about the sustainable fish production practices (fishing or farming) if they were certified by a fish processing industry | TI | 3.97 | 1.51 | 3.91 | 1.44 | 4.43 | 1.41 | 4.65 | 1.47 | 4.47 | 1.45 | 4.29 | 1.49 |
| I would trust the information provided about the sustainable fish production practices (fishing or farming) if they were certified by a retailer | TI | 4.19 | 1.39 | 4.16 | 1.36 | 4.30 | 1.42 | 4.47 | 1.47 | 4.48 | 1.33 | 4.32 | 1.40 |
| I would trust the information provided about the sustainable fish production practices (fishing or farming) if they were certified by an independent organization (e.g., an NGO) | TI | 4.89 | 1.34 | 4.81 | 1.34 | 4.91 | 1.41 | 4.96 | 1.52 | 4.93 | 1.38 | 4.90 | 1.40 |
| I believe that ready-to-cook products would alter the original fish characteristics | AR | 4.91 | 1.32 | 4.45 | 1.15 | 4.47 | 1.25 | 4.95 | 1.39 | 4.52 | 1.21 | 4.66 | 1.28 |
| I prefer to eat ready-to-cook fish because it allows me to save time | AR | 3.89 | 1.66 | 4.49 | 1.34 | 4.03 | 1.46 | 4.03 | 1.65 | 4.34 | 1.58 | 4.15 | 1.56 |
| Preferably, I spend as little time as possible on meal preparation | AR | 3.74 | 1.64 | 4.35 | 1.45 | 3.92 | 1.53 | 3.82 | 1.71 | 4.14 | 1.56 | 3.99 | 1.60 |
| I prefer to eat ready-to-cook fish because it does not smell | AR | 3.39 | 1.60 | 4.19 | 1.36 | 3.62 | 1.60 | 3.59 | 1.68 | 3.98 | 1.56 | 3.75 | 1.59 |
Note: all items are scored on the scale: 1 = Strongly disagree; 7 = Strongly agree.
In general consumers are more warried about the negative consequences of fishing on marine resources, than those of fish farming on the environment (Figure 5). The concern is higher in France and lower in Italy.
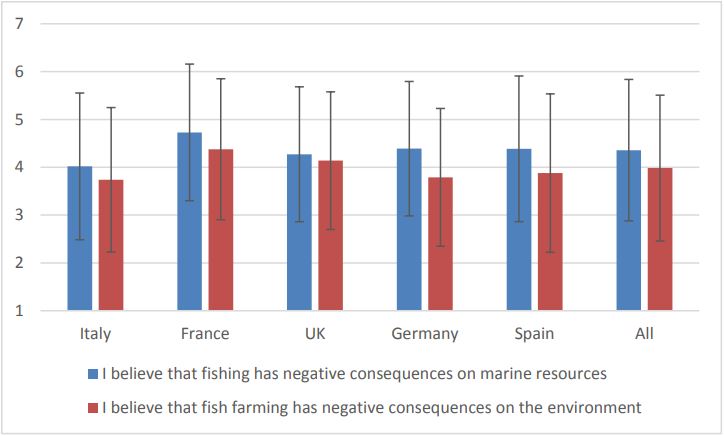 Figure 5: Attitude towards environmental concerns.
In general, respondents believe that fish consumption has more benefits than risks (Figure 6). The benefits are more appreciated in Spain, as well as the risks of negative consequences.
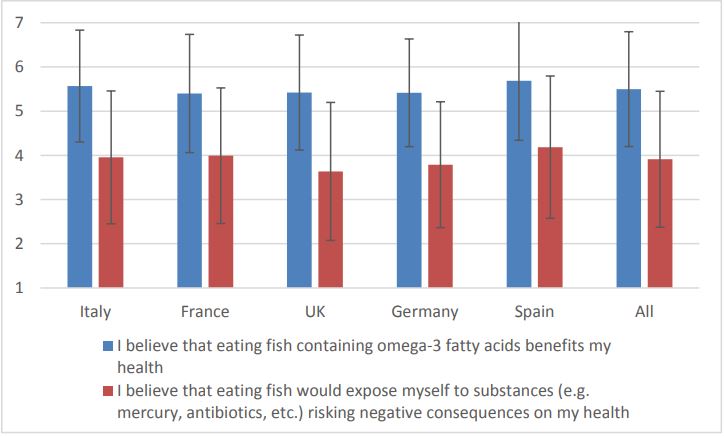 Figure 6: Attitude towards health concerns.
In general consumers are more confident in cooking fish than in evaluating the quality of the fish before buying it (Figure 7).
Consumers’ trust in information provided about the sustainable fish production is higher for independent organizations and public authorities, than for industries and retailers. Trust for farmers and fishermen is higher than trust for industry and retailers in every country. In France, the trust for fish farmers or fishermen is higher than for the public authority (Figure 8).
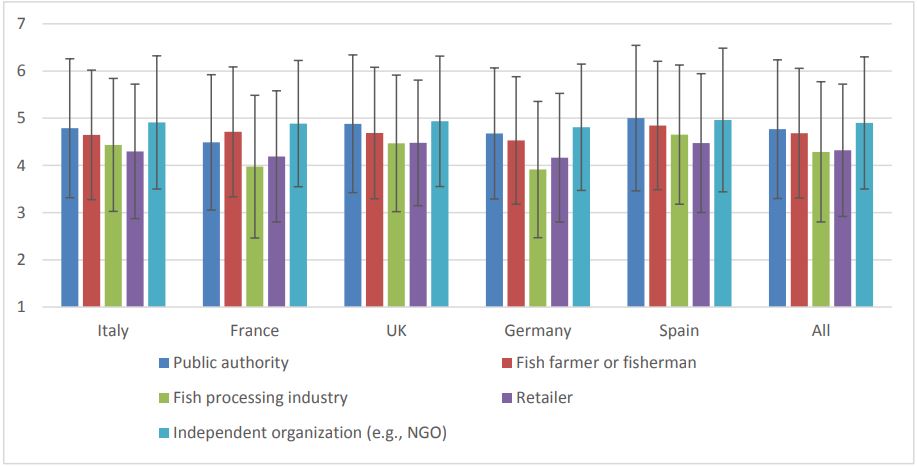 Figure 8: Trust for information about sustainable fish production.
In general, consumers show a rather negative perception about ready-to-cook products, in terms of loss of original characteristics. The preference for ready-to-cook fish products because of saving time is lower than the risk of alter the original fish characteristics (Figure 9). This difference is much larger in France and Spain, while is lower in the UK. Only in Germany consumers’ preference for ready-to-cook fish products is higher than the risk of alter the original fish characteristics.
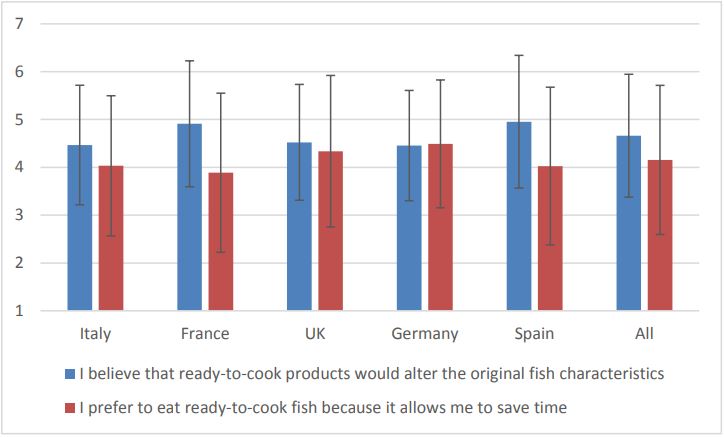 Figure 9: Attitude towards ready-to-cook fish.
Once having performed the choice experiment, the respondents had to state how they believed in the benefits of sustainability certification to the environment and society, and how they believed in the nutrition and health claim. The results are reported in Figure 10 and 11. The belief strength is generally higher for the sustainability certification scheme, while, for both labels, is lower in France compared to Spain, Italy and UK.
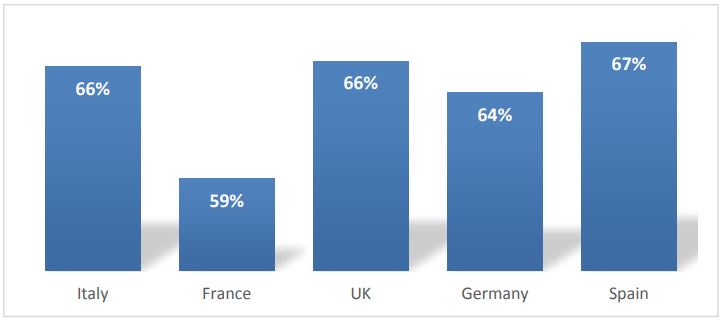 Figure 10: Belief strength about the sustainability label.
Note: “We assume you have read the definition of sustainability certification above. On a scale of 0-100, to what extent do you believe in the benefits of such certification to the environment and society? (e.g., 0 = completely unbelievable; 50 = neutral; 100 = completely believable)
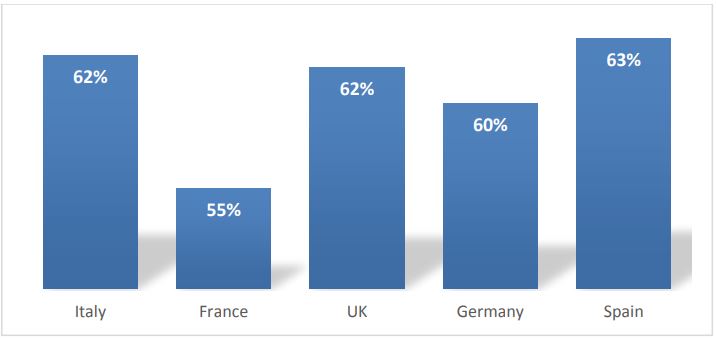 Figure 11: Belief strength about the nutritional and health claim.
Note: “In the marketplace, some producers provide health benefit information from consuming their products. On a scale of 0-100, to what extent do you believe such health benefit claims? (e.g., 0 = completely unbelievable; 50 = neutral; 100 = completely believable).
3.2 The choice experiment results
Two different models were estimated:
- the first one with fish species-specific effects (FSSE); this is needed for obtaining WTP
specific for the 7 species;
- the second one with random price effect (RPE) models; this is needed for
segmentation.
3.2.1 Model specification and estimation
According to Lancaster’s consumer theory (1966), consumer utility stems from product attributes, not the products themselves. In other words, consumer utility can be separated into part-worth utilities. The part-worth utilities equal consumers’ preference for corresponding attributes. In marketing research, the product attributes are classified into extrinsic and intrinsic attributes (Zeithaml, 1988; Olsen et al., 2008). Regardless of whether consumers are exposed to these attributes, they may be important signals of product quality and determinants of consumer preference.
The overall utility that a consumer obtains from consuming a seafood species j (Uj) can be expressed as:
figure equation 1
It is generally assumed that an individual would choose a product alternative if the utility derived from this alternative is maximized compared to the other alternatives:
figure equation 2
When facing a “basket” of seafood products, consumers assign a random utility to each product alternatives and select the one with the highest derived utility. Assuming that the stochastic components εj have independent and identical distributed (iid) forms, the probability of a consumer i choosing a fish product j(P( yij = 1 ) given by the multinomial logit (MNL) model (McFadden, 1974), is expressed in the following equation:
figure equation 3
The MNL model presented in equation (3) is the basic choice model and has been approved to have several disadvantages such as assuming iid of the error and assuming the homogeneity of consumers’ preference. To overcome the limitations of MNL, there many advanced discrete choice models suggested such as the mixed logit models (random coefficient, scaled-multinomial logit, and generalized-multinomial logit) and the latent class model (LCM) (see Fiebig et al., 2010; Greene & Hensher, 2003). We estimated two types of models in this report to elicit the consumers’ WTP for fish attributes that are specific to particular fish species and for individual consumers, named as fish speciesspecific effect model (FSSE) and random (i.e price) parameter effect model. The fish species-specific effect (FSSE) model (fish j), is expressed as:
figure equation 4
where β parameters are estimated for the j-th fish species and for the attributes production method (i.e. Method, as wild caught vs. farmed fish), product format (i.e. Format, as whole fish/round cut, fillet or ready-to-cook), nutritional and health claim (i.e. Health, as with/without nutritional and health claim), and sustainability label (i.e. Sustain, as with/without sustainability certification). The Random price effect (RPE) model is specified so that the price coefficients includes two components, such as the average effect of price and the individual variance of price effects, expressed as:
figure equation 5
where αj, βk are fixed-effect coefficients, γ3 is random coefficient of price estimated for individual i. The specification of FSSE allows us to calculate the willingness to pay (WTP) for each of seven fish species in the choice experiment, while random price effect model allows us to elicit the WTP of each fish attributes at individual consumers’ level. The WTP for a non-monetary attribute is the price premium that consumers are willing to pay for obtaining a desired attribute level. The WTP for an attribute level A (e.g. health) from FSSE model in equation (4) is calculated as:
figure equation 6
where 𝑊𝑇𝑃Aj is the price premium paid for obtaining a desired level of attribute A (i.e., product with health claim) of the fish j, and β𝐴𝑗 and β5𝑗 are the estimated coefficients of attribute A and price attributes of fish j. Similarly, the WTP for attribute A (not specific to fish species) at consumers' individual level (𝑊𝑇𝑃𝐴i) is calculated from model in equation (5) is:
figure equation 7
We estimate the WTP specific to fish species with expectation that consumers‘ preference for fish quality attributes depends in specific species (Thong et al., 2015). For instance, consumers may prefer filleted cod to the whole fish cod, but they may prefer whole fish herring to the filleted herring. The WTP for fish quality attributes are calculated at individual consumers because the nature of heterogeneity of preference. The random price effect model also allows us to obtain choice probability for fish species at the individual consumer‘s level. The individual consumers‘ choice probability thus will be used for segmentations that are actionable for marketing strategy and developing the decision support system (DSS). The segments are derived in every country using SAS macros, and three parameter criterion: cubic clustering criterion (Sarle, 1983), Pseudo-F statistics (Calinski and Harabasz, 1974), and Pseudo-t squared statistics (Duda and Hart, 1973).

