CPA
Contents
Competitive Position Analyser
Introduction
The Competitive Position Analyser tool is the computerised version of the FACI survey and it is the implementation of the models described in this page. The concept of competitiveness can be traced back to early writing on economics in the 17th and 18th centuries, but has become ever more urgent in the last decades with rapid improvements in transport and communication and a higher level of globalisation. Although competitiveness may be measured by single indicators, such as productivity of labour, a deeper understanding of the competitive standing of firms and countries can be gained by employing multi-dimensional measurements.
The choice of methods depends on a variety of factors, including the perceived need for complexity, data availability and how the results are to be used. The Fisheries and Aquaculture Competitiveness Index (FACI) developed in this deliverable is modelled on the Fisheries Competitive Index (FCI) developed by the Directorate of Fresh Fish Prices in Iceland and the Norwegian College of Fishery Science at the University of Tromsø in 2004-2005. The FACI though expands on the FCI in two directions. First, by developing a national-level FACI that also includes aquaculture. Second, by designing a firm-level FACI that is intended to capture the views of operators of individual firms and is therefore less complex. The national-level FACI consists of 144 items, whereof 44 are taken from the WEF Global Competitiveness Index, 19 are based on data obtained from national, public sources and 81 are based on answers from a survey conducted among specialists in each country. . Whereas the information taken from the GCI analyses the overall competitiveness of the nation, the other sources will throw light on the competitiveness of the fisheries and aquaculture sectors. The firm-level FACI is based on a survey which in the case of firms engaged in the harvesting, processing or marketing of wild capture fish consists of 40 questions, and in the case of aquaculture firms consists of 45 questions.
The FACI was employed to analyse the competitiveness of three fisheries firms in Norway, one in Iceland and one in Newfoundland, and assess the competitive standing of Spain, Iceland, Norway and Vietnam. Newfoundland was also included in the national study, but the comparison is incomplete due to some gaps in the information collected. The firms in Newfoundland and Iceland were found to have a competitive edge over their Norwegian competitors, mostly due to their ability to fend of new entrants, flexible value-chains and high level of R&D development and innovation. At the national level, Iceland, Norway and Spain all ranked close .
The tool
The | CPA tool is the implementation of the FACI survey both at firm-level and national-level. It can be accessed by clicking the quick access icon for the CPA in the | PrimeFish DSS home page or by clicking the appropriate menu link in the top navigation bar.
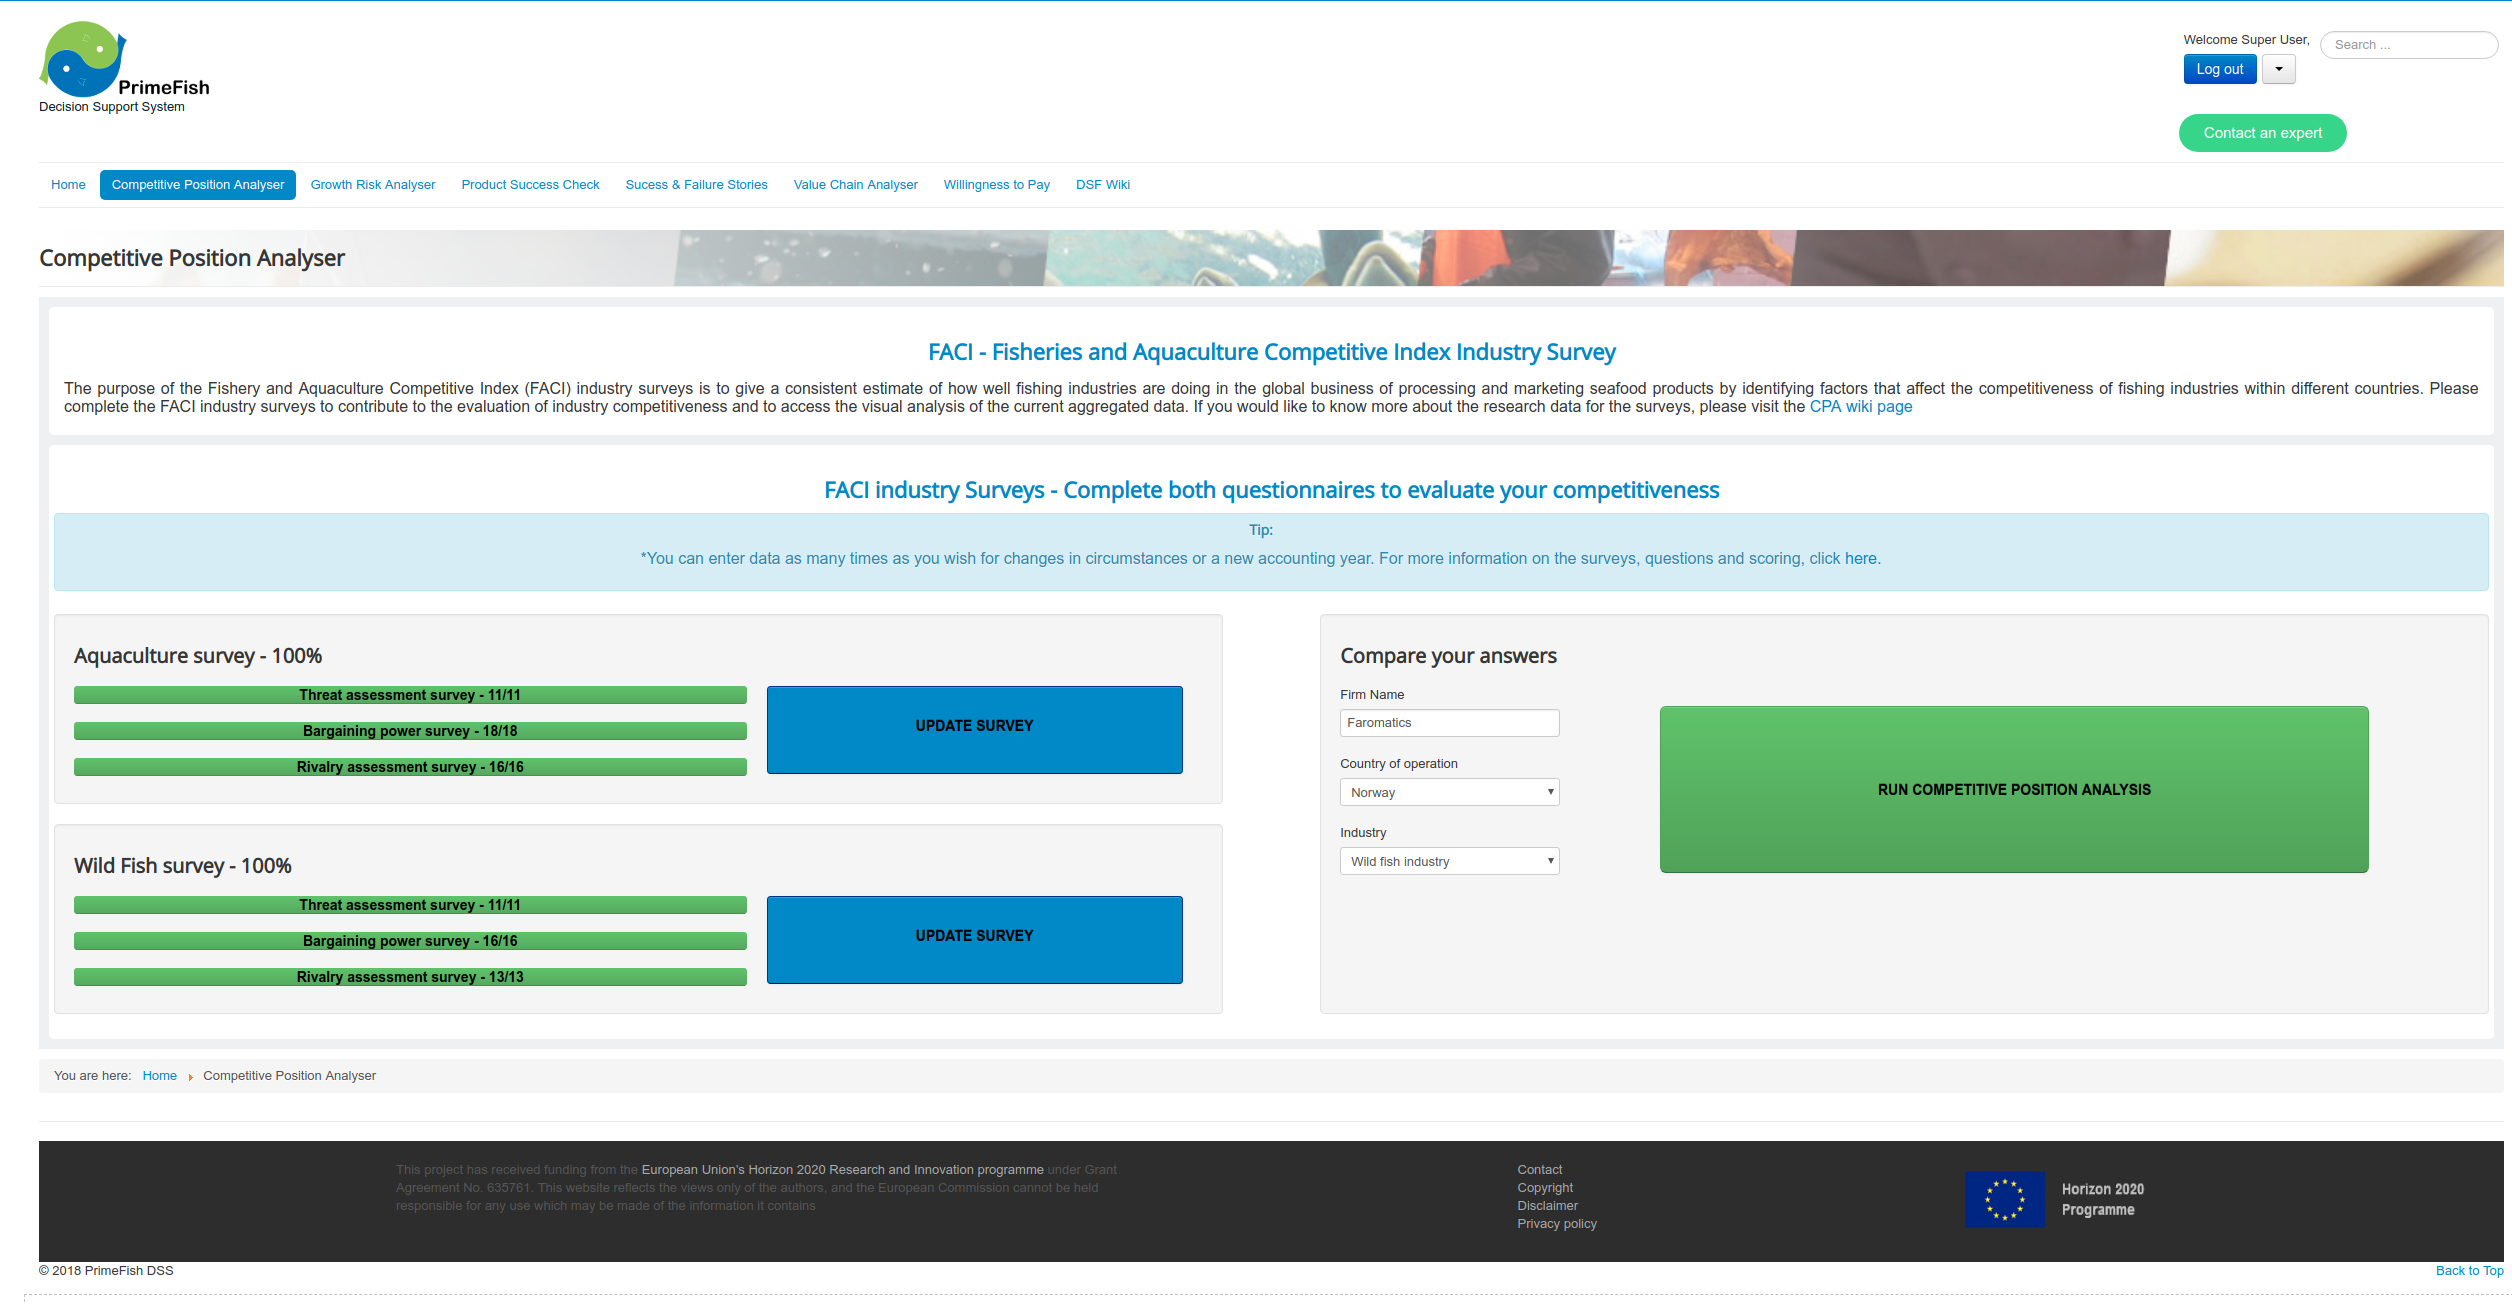
CPA home page
In the home page the users can define their company's profile information, including the country, which is used as a parameter to select which values to display as a benchmark when running the CPA tool. If the user selects France as their company's country, the results will be compared against the data collected for France. The user can change the value of any of the input fields in the Company Profile section located in the left side of the home page and click the update button to save the changes.
Right below this section the users can select additional search parameters before running the CPA tool. These parameters will set which industry, species and market data will be shown in the results page. Once the user click the Run CPA tool button, the user will be redirected to the results page where a graphical analysis will be shown. Completion of any survey is not required to run the tool, however any references to user value will be set to zero in the graphical comparison in the results page.
The firm-level survey can be accessed by clicking its respective Update survey button on the right section of the CPA home page, which will redirect the user to the survey page for the chose survey. The surveys are divided in two sections by industry (Aquaculture/Wild fish) and each one is further subdivided into three subsections:
- Threat Assessment Survey
- Bargaining Power Survey
- Rivalry Assessment Survey
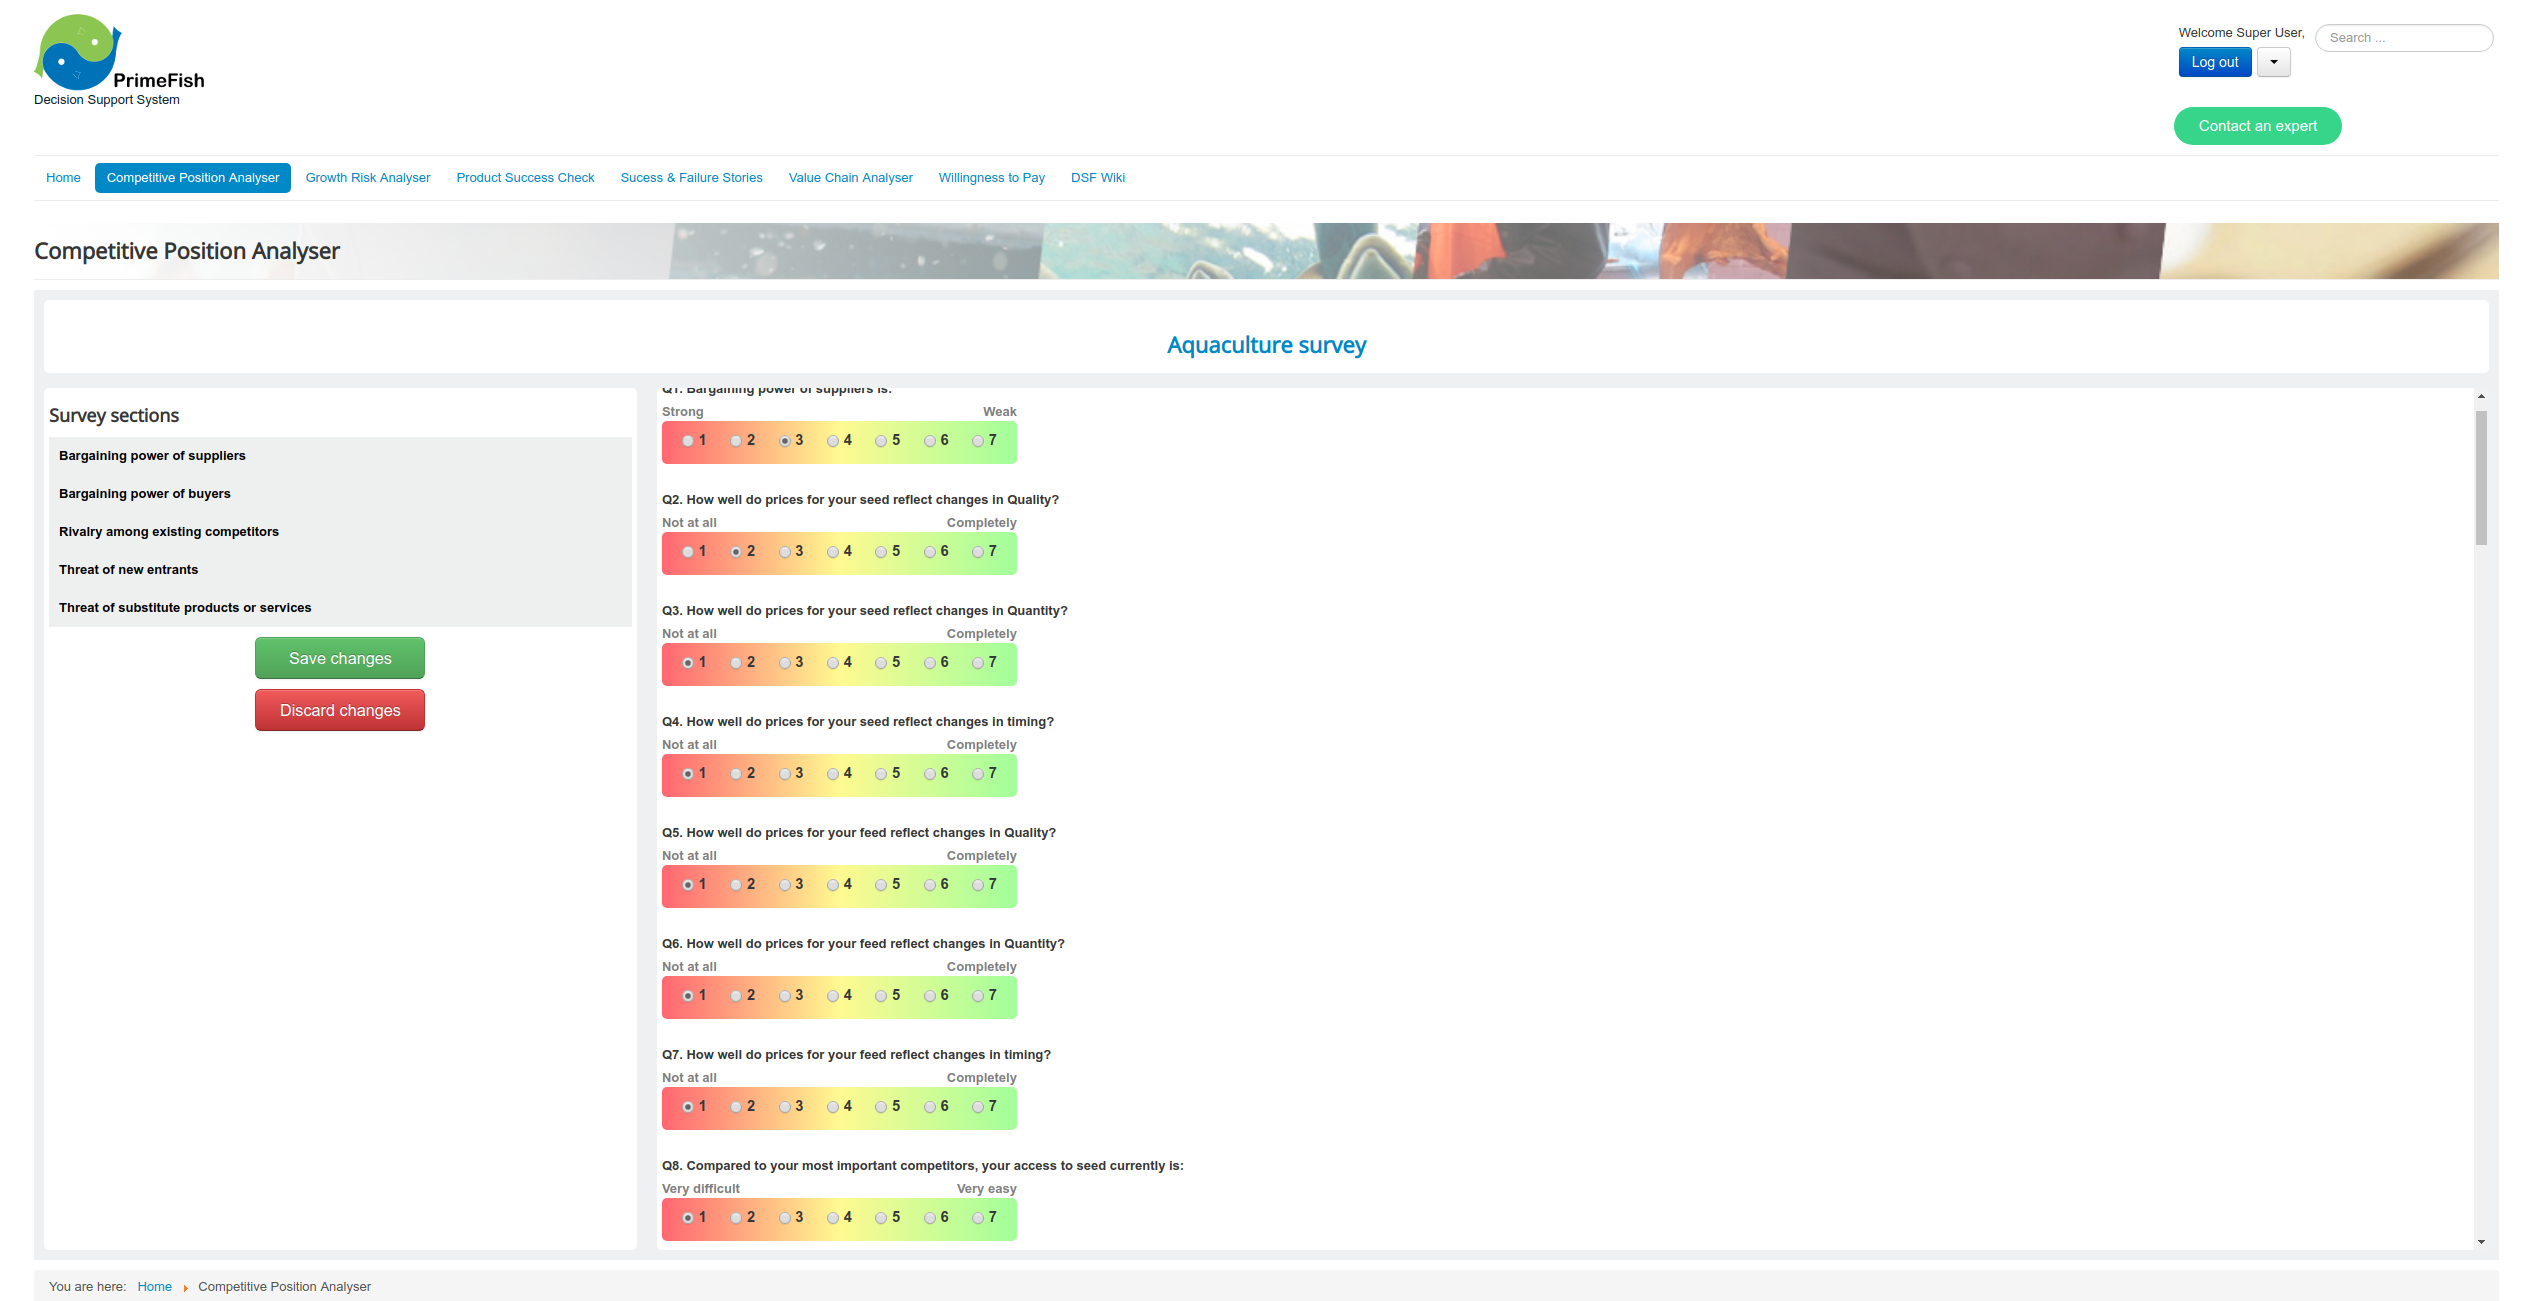
CPA survey pages
After clicking the appropriate button and being redirected to the survey page, the user can then analyse and answer the survey by choosing the answers from the array of possibilities and then choosing to move to the next/previous survey or by returning to the home page. The survey answers are automatically saved as long as the user clicks one of the blue buttons on the bottom page of the current survey page to go to the next/previous survey or to go to the home page. If the users clicks the red Discard changes button, the current changes will not be saved and the user will be redirected to the CPA home page. The answers can be updated at any time and as many times as needed. Once the user is satisfied with his answers he can run the CPA tool by clicking the Run CPA tool button in the home page to get the results relative to their answers. The user can answer as many or as few questions from any survey as he/she wants, and return at any point in time to change their answers. A yellow progress bar for each subsection of the surveys is shown in the CPA home page to let the user know of the progress they made. If no answers have been given for a particular survey subgroup, no progress bar is shown and once the user answers all questions in a survey subgroup, the progress bar will turn green. The more answers the user gives, the more accurate the calculation for the CPA will be.
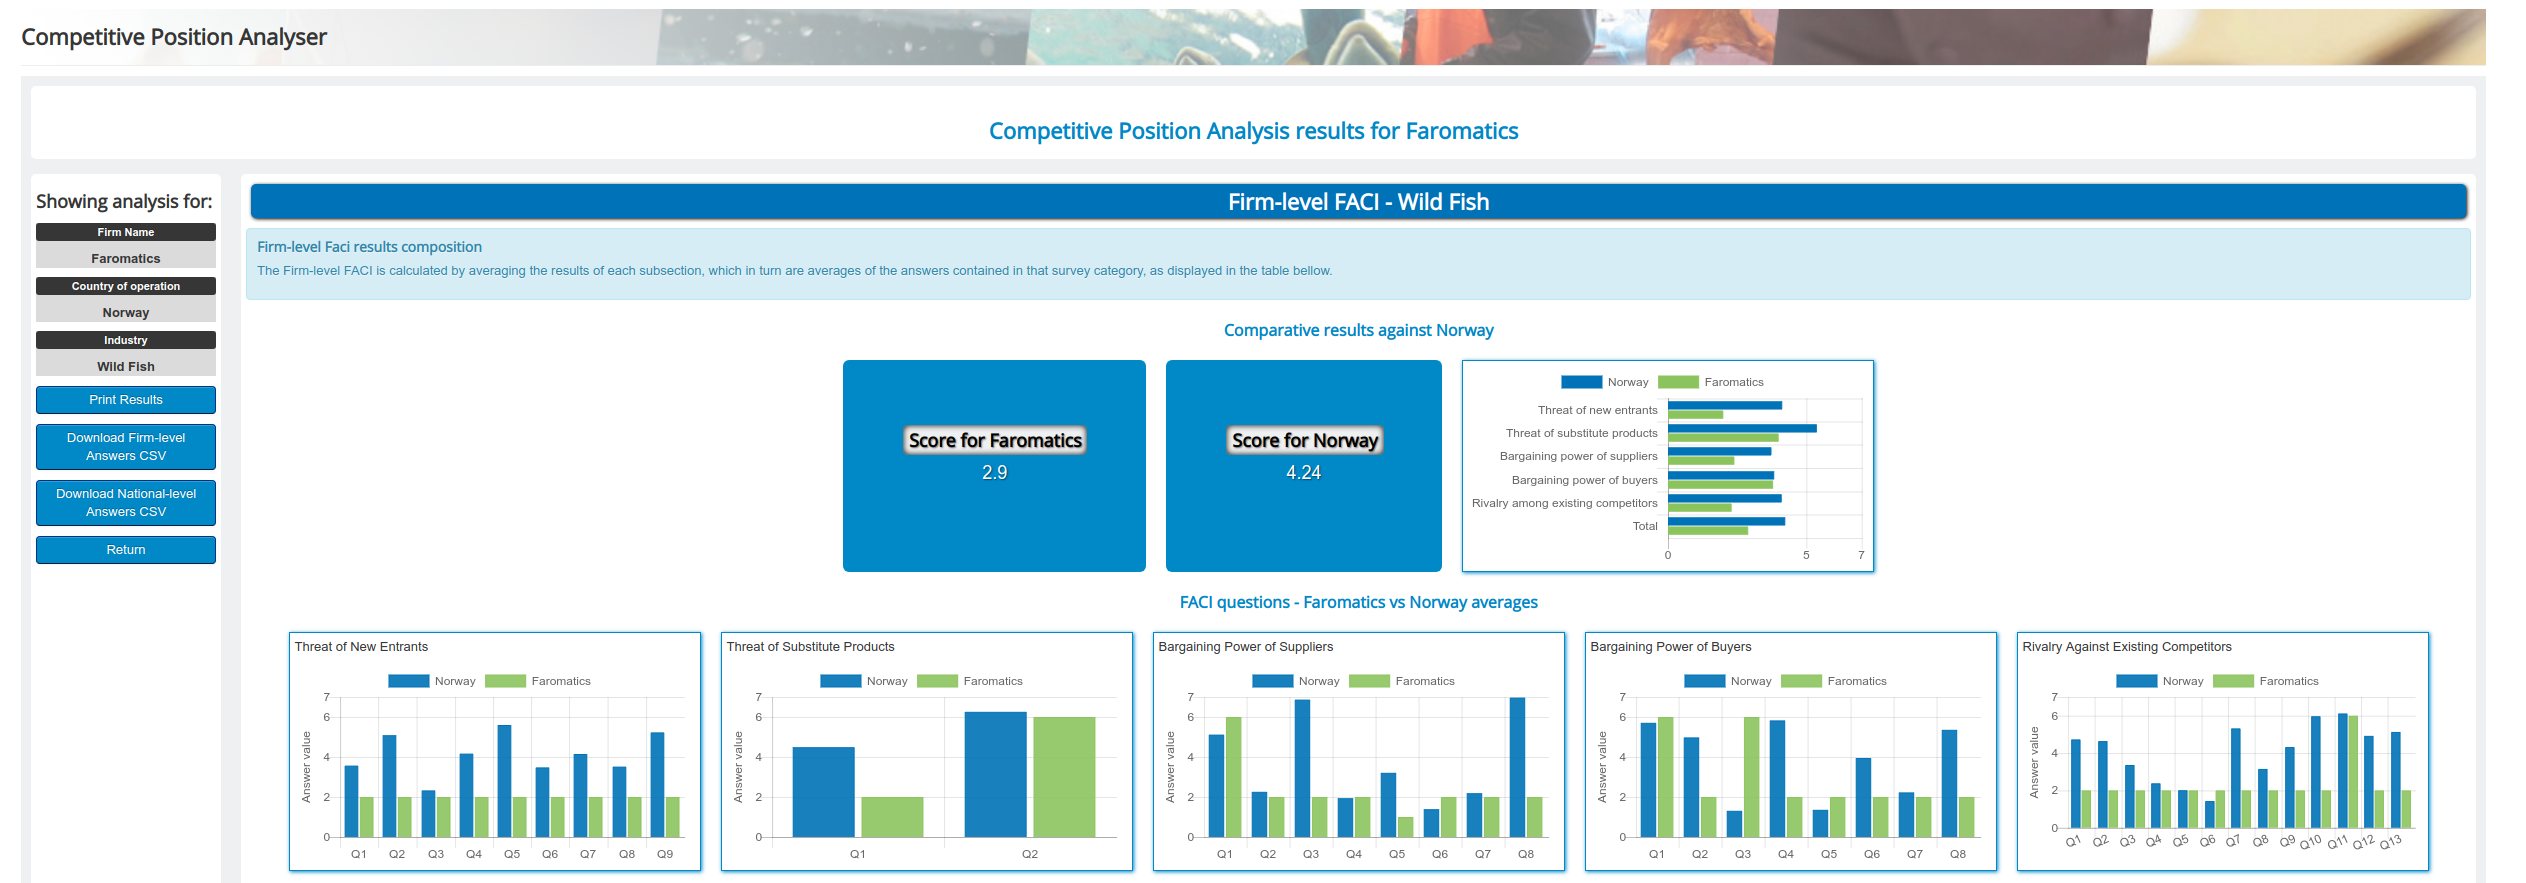
CPA results page
When the user clicks the Run CPA tool button, the results page will first display the user's FACI score, with details about their average score in each section and also detailed comparative scores for each answered question.
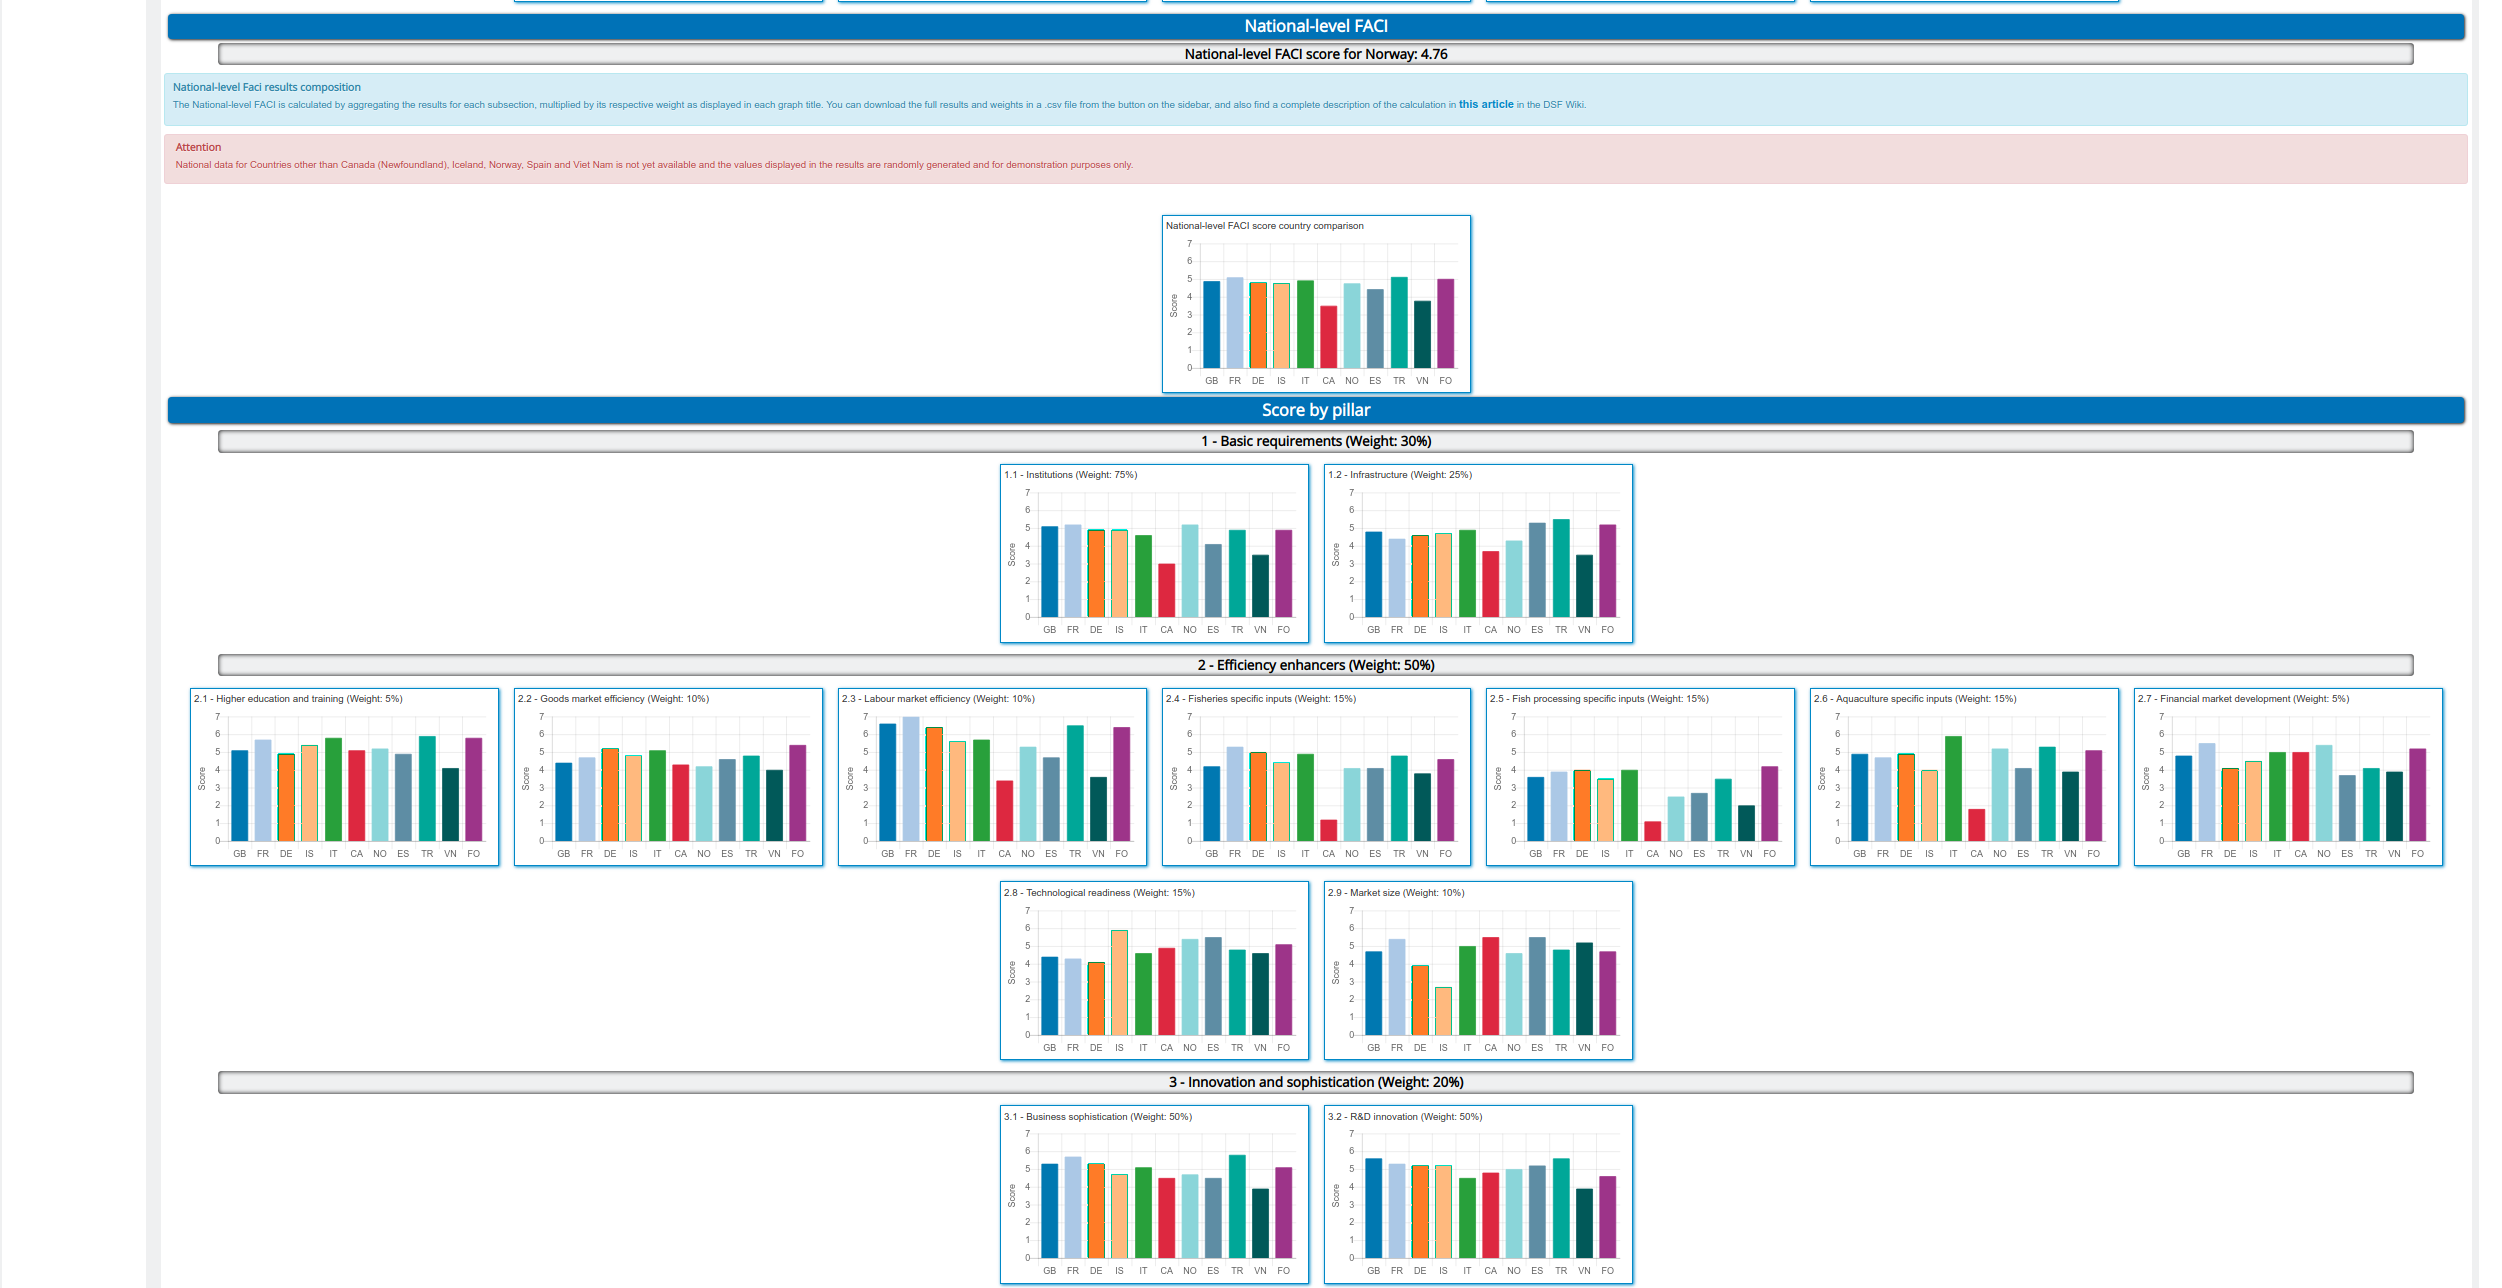
The tool will also display the comparison between the user's chosen country National-level FACI score against all other countries participating in the study, with graphics also detailing the average score for each pillar and its sections. The user can choose to print the results by clicking the button on the sidebar in the results page, in addition to having the ability to download the bulk data collected in the research phase. The user can also return to the CPA home page and start another analysis or choose to use any other feature of the DSS.


