Difference between revisions of "Deliverable 3.1"
Jacandrade (talk | contribs) |
Jacandrade (talk | contribs) |
||
| Line 361: | Line 361: | ||
| − | ==Atlantic cod== | + | ===Atlantic cod=== |
| − | ===Introduction=== | + | ====Introduction==== |
Four countries with particular relevance to Atlantic cod supply in Europe – Norway, Iceland, the UK | Four countries with particular relevance to Atlantic cod supply in Europe – Norway, Iceland, the UK | ||
| Line 582: | Line 582: | ||
|} | |} | ||
| − | ==Landings/supply== | + | ===Landings/supply=== |
| − | ===Iceland=== | + | ====Iceland==== |
Supply of materials is mainly landings from Icelandic boats fished within the Icelandic exclusive | Supply of materials is mainly landings from Icelandic boats fished within the Icelandic exclusive | ||
| Line 642: | Line 642: | ||
''Figure 5. Net profit in fishing and fish processing, 1993-2013. Matis'' | ''Figure 5. Net profit in fishing and fish processing, 1993-2013. Matis'' | ||
| − | ===Norway=== | + | ====Norway==== |
Cod is the most important species in Norwegian commercial fisheries, with about 1/3-of total catch | Cod is the most important species in Norwegian commercial fisheries, with about 1/3-of total catch | ||
| Line 717: | Line 717: | ||
''Figure 12. Seasonality in landings – monthly catches as share of total – Norway and Iceland, weighted average. Source: Directorate of Fisheries and Statistics Iceland'' | ''Figure 12. Seasonality in landings – monthly catches as share of total – Norway and Iceland, weighted average. Source: Directorate of Fisheries and Statistics Iceland'' | ||
| − | ===Canada=== | + | ====Canada==== |
Historically, the Canadian cod fishery has played a major role in the global supply of white fish. | Historically, the Canadian cod fishery has played a major role in the global supply of white fish. | ||
| Line 809: | Line 809: | ||
[[File:d31_tab_6.png|center|Table 6]] | [[File:d31_tab_6.png|center|Table 6]] | ||
| − | ===UK=== | + | ====UK==== |
The majority of cod landed into the UK by British vessels was captured in the North Sea (ICES area | The majority of cod landed into the UK by British vessels was captured in the North Sea (ICES area | ||
| Line 834: | Line 834: | ||
premium attached to the method by which the fish are captured.' | premium attached to the method by which the fish are captured.' | ||
| − | ==Imports== | + | ===Imports=== |
| − | ===UK=== | + | ====UK==== |
The UK is a net importer of cod. For the period 2000 -2014, UK imports of cod ranged between about | The UK is a net importer of cod. For the period 2000 -2014, UK imports of cod ranged between about | ||
| Line 859: | Line 859: | ||
Figure 18. Value of cod imported to the UK by type of product: 2000-2014. Source: HM revenue and Customs | Figure 18. Value of cod imported to the UK by type of product: 2000-2014. Source: HM revenue and Customs | ||
| − | ===Canada=== | + | ====Canada==== |
Due to limited domestic supply, Atlantic cod is also imported into Canada for further processing (and | Due to limited domestic supply, Atlantic cod is also imported into Canada for further processing (and | ||
| Line 870: | Line 870: | ||
''Figure 19. Canadian imports of Atlantic cod. Source: Statistics Canada, International Trade Division'' | ''Figure 19. Canadian imports of Atlantic cod. Source: Statistics Canada, International Trade Division'' | ||
| − | ==Processing== | + | ===Processing=== |
| − | ===Iceland=== | + | ====Iceland==== |
Fish processing has undergone significant consolidation in the last two and a half decades, resulting | Fish processing has undergone significant consolidation in the last two and a half decades, resulting | ||
| Line 915: | Line 915: | ||
20% of wet-fish is processed fresh but generates 30% in export value). | 20% of wet-fish is processed fresh but generates 30% in export value). | ||
| − | ===Norway=== | + | ====Norway==== |
Naturally, the Norwegian cod processing industry, caretaking volumes in levels up to 450 000 tonnes | Naturally, the Norwegian cod processing industry, caretaking volumes in levels up to 450 000 tonnes | ||
| Line 991: | Line 991: | ||
on board nor on land. | on board nor on land. | ||
| − | ===Canada=== | + | ====Canada==== |
The processing capacity in NL has been decreasing, from 148 in 2001 to 94 in 2014 (Table 7). Error! | The processing capacity in NL has been decreasing, from 148 in 2001 to 94 in 2014 (Table 7). Error! | ||
| Line 1,010: | Line 1,010: | ||
[[File:d31_tab_8.png|center|Table 8]] | [[File:d31_tab_8.png|center|Table 8]] | ||
| − | ===UK=== | + | ====UK==== |
In 2014, there were 403 fish processing units in the UK providing a total of 19,511 FTE (full time | In 2014, there were 403 fish processing units in the UK providing a total of 19,511 FTE (full time | ||
| Line 1,043: | Line 1,043: | ||
been driven by higher raw material costs, which were not fully passed on to customers | been driven by higher raw material costs, which were not fully passed on to customers | ||
| − | ==Export== | + | ===Export=== |
| − | ===Iceland=== | + | ====Iceland==== |
In 2014 the total export of the Icelandic seafood industry is around about 245 billion Icelandic krónur | In 2014 the total export of the Icelandic seafood industry is around about 245 billion Icelandic krónur | ||
| Line 1,086: | Line 1,086: | ||
''Figure 26. Price index of cod products, 2008 to 2015. Reference 4 quarter 2005 =100'' | ''Figure 26. Price index of cod products, 2008 to 2015. Reference 4 quarter 2005 =100'' | ||
| − | ===Norway=== | + | ====Norway==== |
Figure 27 shows how Norwegian cod exports have been relatively stable in the period 2000 to 2013 | Figure 27 shows how Norwegian cod exports have been relatively stable in the period 2000 to 2013 | ||
| Line 1,186: | Line 1,186: | ||
cent (NOK 30 vs. NOK 25 per kg). | cent (NOK 30 vs. NOK 25 per kg). | ||
| − | ===Canada=== | + | ====Canada==== |
Canada is a major seafood exporting nation, ranked 7 th among the major exporters worldwide in | Canada is a major seafood exporting nation, ranked 7 th among the major exporters worldwide in | ||
| Line 1,199: | Line 1,199: | ||
''Figure 33. Canadian exports (in $ CND) of Atlantic cod. Source; Statistics Canada, international Trade division'' | ''Figure 33. Canadian exports (in $ CND) of Atlantic cod. Source; Statistics Canada, international Trade division'' | ||
| − | ===UK=== | + | ====UK==== |
In 2014, the UK exported 14,900 tonnes of cod products (equivalent to 41,200 t live weight) with a | In 2014, the UK exported 14,900 tonnes of cod products (equivalent to 41,200 t live weight) with a | ||
| Line 1,215: | Line 1,215: | ||
Figure 35. Value of cod exports from the UK by type of product. Source: HM Revenue & Customs | Figure 35. Value of cod exports from the UK by type of product. Source: HM Revenue & Customs | ||
| − | ==Consumption== | + | ===Consumption=== |
| − | ===Canada=== | + | ====Canada==== |
Canada’s per capita consumption of seafood has remained relatively stable since 1988 with an | Canada’s per capita consumption of seafood has remained relatively stable since 1988 with an | ||
| Line 1,223: | Line 1,223: | ||
frozen state (47%), followed by processed fish (29%), shellfish (20%), freshwater fish (4%). | frozen state (47%), followed by processed fish (29%), shellfish (20%), freshwater fish (4%). | ||
| − | ===Iceland=== | + | ====Iceland==== |
The local consumption in Iceland is small percentage of the total cod caught. In 2013 were 3.800 | The local consumption in Iceland is small percentage of the total cod caught. In 2013 were 3.800 | ||
| Line 1,231: | Line 1,231: | ||
chunks are sold through the HORECA sector. | chunks are sold through the HORECA sector. | ||
| − | ===UK=== | + | ====UK==== |
The consumption of cod in 2014 represented about 23% of all fish consumed by UK households. | The consumption of cod in 2014 represented about 23% of all fish consumed by UK households. | ||
| Line 1,255: | Line 1,255: | ||
meals per annum. Annual spend on fish and chips in the UK is around €1.36 billion. | meals per annum. Annual spend on fish and chips in the UK is around €1.36 billion. | ||
| − | ==Summary== | + | ===Summary=== |
Iceland and Norway are two of the world’s largest suppliers of cod, having access to abundant cod | Iceland and Norway are two of the world’s largest suppliers of cod, having access to abundant cod | ||
Revision as of 19:24, 13 March 2018
Contents
Deliverable D3.1 - Report on description of value chains and input-output structure
Summary
This report describes the main material flow in the supply chain (input-output structure) for the six commodity species (or species groups) that are the focus of PrimeFish; four farmed and two capture: (i) Atlantic Salmon, (ii) Rainbow Trout, (iii) European Sea bass (Dicentrarchus labrax) and gilthead sea bream (Sparus aurata) (iv) Pangasius catfish (Pangasius hypophthalmus) (v) Atlantic Cod (Gadus morhua) (vi) Atlantic Herring (Clupea herrengus). The latter two species are selected as examples of demersal and pelagic fisheries. Sea bass and sea bass are treated as a single group as almost perfect substitutes, sharing very similar production and post-harvest value-chain characteristics. The report is a synthesis of 17 individual value-chain reports. The report is based on publicly available data, and for each species covers (a) farmed production or landings (b) imports (c) processing (d) export (e) consumption.
Atlantic cod
Iceland and Norway are two of the world’s largest suppliers of cod, having access to abundant cod stocks in Norwegian and Icelandic waters. The catches have been growing over the last few years in in both Iceland and Norway. On the other hand, the UK has a small contribution to global catches even though quotas are slightly increasing. Since the collapse of the Canadian stocks of cod in early ‘90’s Canada has lost its global presence and its current landings represent a minor share of the global production of cod. There are indications that cod stocks in Canada may be recovering. In all countries there is a trend to consolidation in the industry towards fewer and larger vessels and companies. The bulk of the cod landings in Norway, Iceland and the UK are delivered by relatively large vessels in contrast Canada where boat of less than 10m in length still predominate. In Iceland there has been a shift from use of gillnets to trawl and long line. This can be explained to some extent by the better quality of product resulting from the latter methods of fishing. Consistent with this change, over recent years Iceland has specialised in production and export of fresh fillets with high quality assurance.
A large and increasing proportion of the Norwegian catch is landed frozen, while in Iceland the number of freeze trawlers have declined with a concomitant shift towards fresh landings and processing on land. The UK fleet lands its catches of cod whole fresh or gutted and a significant proportion of landings originate from third-country vessels. Canadian catches of cod are landed exclusively as fresh fish, destined primarily for primary processing and local retailing. Compared to Norway, Iceland benefits from lower variability in landings throughout the year which is an advantage when it comes to supplying multiple retail chains requiring continuity and predictability of supply.
With the exception of some foreign vessel landings in Norway, there is negligible import of cod to Iceland or Norway associated with their successful management of well-endowed fisheries. The UK on the other hand is a major market and importer of cod products, particularly frozen fillets which represent the highest share of imports. The main exporting countries to the UK are Iceland, China and Norway. Due to limited domestic supply, Atlantic cod is also imported into Canada for further processing and re-export and to supplement domestic markets though imports have declined over the last decade.
Cod processing in Norway, Iceland and the UK has undergone significant consolidation resulting in fewer but larger companies. In Iceland the consolidation process has been accompanied by increased investment and modernisation resulting in increased productivity, product quality and profitability.
In Iceland cod is predominantly processed into fresh fillets for export and the share of salted and dried products has declined over time. In Norway, by contrast a significant proportion of cod is still processed into dried and/or salted fish as well as frozen whole. The majority of UK companies processing cod specialise in secondary processing, primarily of imported frozen fillets into value added products. The Canadian processing sector consists of mainly small-scale primary processing companies, reliant partly on imports and partly on domestic landings.
The vast majority of the cod landed and processed in Iceland and Norway is exported. The main export markets for cod from Iceland are within the EU. Similarly, large proportion of the Norwegian exports target EU countries. In Norway the share of unprocessed whole gutted cod has increased in the last few years, particularly to China and Lithuania, where the fish undergoes further processing. Norway is also a main supplier of salted and dried fish to Portugal, which represents the largest market for these products. Exports from the UK are minor compared to Iceland and Norway and target mainly other EU member states. Canadian exports are also small and declining with the US and UK the major destinations.
Detailed publicly available data on retail and consumption is most readily accessible in the UK, where cod is one of the three most consumed species, along with salmon and tuna. The majority of cod sales in the UK are in the retail sector as fresh or frozen products. A large proportion of cod is also sold through food service outlets including traditional ‘fish and chip’ shops. In Iceland cod for the domestic market is mainly retailed through fishmongers and Horeca.
Atlantic herring
In all study countries catches of herring declined over the last decade reflected in lower quotas. Herring is currently targeted by the largest vessels in the national fleets of the countries examined here (>40m length). A trend of consolidation of vessel and quota ownership for pelagic species occurred across all main producer countries. This trend is likely driven by economies of scale which fishing for pelagic species benefits from together with the relatively low market prices commanded by pelagic species. Purse seine was the main gear type used in Norway, Denmark and the UK, while Iceland relied mostly on trawling gears.
The great majority of landings across countries was destined for human consumption and this share has been growing over time. In all countries most herring was processed by a few large companies, often vertically integrated; also owning multi-species pelagic fishing vessels. Thus the level of concentration in processing has been mirrored in the capture sector. Denmark and Germany undertook most of the secondary processing, while main producer countries (Iceland and Norway) exported unprocessed or minimally processed herring products. The share of value added herring products from Iceland has declined in favour of low value added, filets and frozen fish, the production of which benefits from economies of scale.
Germany and Denmark with large consumer markets and processing capacity import substantial amounts of herring. Imports to Norway and the UK were mostly low value fresh fish landed in those countries by foreign vessels. A small quantity of value-added herring imports in Iceland is directed to the domestic consumption market.
Almost the entire landings of herring in Iceland and Norway were destined for export. The main markets have historically been Eastern Europe and Russia. However, these markets have recently become less important due to political reasons. Denmark supplies Central and Northern European countries while the UK supplies Western Europe and African countries.
Atlantic salmon
Salmon production around the world has steadily matured into an industry dominated by vertically and horizontally integrated multinational companies. Among the three countries examined here, the Faroese salmon industry is by far the most consolidated followed by Scotland and Norway.
Consolidation has been accompanied increased investment and consequent improvements in productivity and competitiveness. Mergers and acquisitions have played a central role in sector consolidation as increasingly stringent environmental regulations have limited ‘organic’ expansion in more sheltered inshore sites European and other countries.
Environmental conditions in the Faroes, notably water temperature are more stable throughout the year than in Norway or Scotland. Norwegian and Scottish production has stabilised following 3 decades of rapid growth, while in the Faroes, growth continues. In all three countries 'Boom and bust cycles', linked to overproduction and falling prices appear to have moderated with industry consolidation.
Most processing is limited to gutting, freezing and filleting in the Faroes and Norway due to export tariffs for value-added products linked to the countries membership of the EAA but not the EU. A large share of UK production is processed into value-added goods where a large domestic market exists, salmon being the top retail seafood. The UK also imports significant amounts of salmon from Non-EU countries especially the Faroes and Norway which is mainly farmed for export.
Although the UK has seen significant export growth, most export production originates from non-EU countries. Faroese exports have recorded strong growth in the German, UK, USA, Chinese and particularly Russian market (the Faroes were excluded from the ban on imports from western countries introduced in 2014). Norway has achieved strong growth in exports to the EU, which also accounts for the vast majority of its exports. The Faroes specialise in production of ‘above-average’ sized salmon commanding a better price than typical Norwegian and Scottish salmon. However, Scotland achieves a premium for its ‘Label Rouge’ certified premium quality salmon (around 8% of production) further enhanced by ‘Scottish’ origin branding.
Rainbow trout
Production of rainbow trout in Spain and the UK has declined in the period 2000-2014 to reach similar volumes of around 15,000 t in both countries. UK production is predominantly of table-size trout. Only the largest company is progressively transitioning to marine cage farming. Production in Spain is also mainly of table-size trout. Denmark and Italy both exhibit relatively stable production trends, though Denmark has increased the share of production originating from modern recirculation systems (RAS). Around one quarter of Danish output also originates from marine cages where fish are grown to a larger size. Turkey farms more trout than the other four study countries combined and only here has output increased substantively over the last decade, though growth has also flattened here over the last few years. Most output comes from land-based pond and raceway systems where fish are grown to around 300g. Larger export-orientated companies are attempting to farm larger sizes in order to avoid tariffs on import of table size trout into the EU. The number of companies involved in trout production in all EU countries has been decreasing. This is part of an overall European-wide trend for consolidation in aquaculture. In the UK less than 10 companies account for more than half of the domestic trout production, while the Danish sector has shown an increased output per farm due to growing productivity and increased capacity. In Turkey trout aquaculture is still composed of a large number of small owner-operated companies, however with increasing presence of integrated export-oriented companies.
Limited data on trout processing indicates that in the Spain and the UK trout undergoes small amounts of processing, being marketed mostly as a fresh whole fish on the domestic market. Larger size trout from the UK however is processed into a variety of value-added products. Denmark shows the highest level of value-addition where smoked trout products occupy the largest share of trout processing and export. In Italy, where the market has traditionally been for whole fresh fish, value- added trout products increasingly gain prominence on the domestic market but exports continue to be composed of whole fresh fish or fresh fillets. Turkey has focused on a combination of lower value frozen whole fish and higher value smoked trout. Limited international trade with trout was recorded in the UK in the period 2000-2014. Slightly higher but more stable levels of export were present in Spain. Of all countries, Denmark recorded the highest level of exports in terms of value, around half of which represented by smoked trout products.
Exports from Italy and Denmark are mainly to the EU whilst Spanish exports fresh trout are more limited to neighbouring countries. Turkey mainly exports whole frozen and smoked trout with Germany being as its largest market where it competes directly with significant amounts of smoked trout produced and exported from Denmark.
Sea bass and sea bream
Sea bass and sea bream form a significant proportion of EU aquaculture output. Production and market demand is concentrated around the Mediterranean. Greece is the world’s largest producer of sea bream and second largest in sea bass after Turkey. However its production has stabilised and even slightly declined over recent years, likely due to market saturation. The same can be said about the Italian sector. The only growth in production was for sea bass in Spain. Spain grows fish to a larger size than Greece and achieves a better price on the international market.
Value chains for these species are less vertically integrated ‘upstream’ because of technical requirements in the reproduction and on-growing stages, resulting in the formation of specialised firms dealing with brood stock and juvenile production. However, the exact number of establishments in each link of the value chain for sea bass and sea bream could not be confirmed.
In Mediterranean markets sea bass and sea bream are mostly sold whole fresh with only limited processing, mainly filleting. This lack of specialisation means value chains are shorter than for other aquaculture species such as salmon. Thus there is little differentiation on product attributes apart from size, and there is a higher tendency for price swings due to overproduction. The largest share of production reaches consumers through modern retail supermarkets and hypermarkets purchasing directly from farms.
Consumption of sea bream and sea bass produced in the EU is also largely confined to the EU. Italy, which produces relatively little sea bass and sea bream is the main market for Greek exports. Spain has closed its trade gap for sea bass in recent years steadily growing its production for domestic consumption and export.
Pangasius
Commercial output of Vietnamese Pangasius catfish increased from 22,500 MT to more than 1 million MT between 1998 and 2007 whilst export values rose from $19.7 million to $0.98 billion. Total Vietnamese Pangasius production in 2008 (all of which originated from just nine Mekong Delta provinces) was estimated at 1.2 million MT, with an export value of approximately $1.45 billon. Although most farms are still smaller than 1ha, consolidation of the pangasius sector over the last decade has resulted in increasing domination by large-scale producers with concomitant shedding of small-scale producers. The remaining smaller operations are likely to contract-farm for lager vertically integrated farms. Most of the large-scale commercial farms are owned and operated by export companies while most of the small-scale are operated by individual households. International markets continue to pressure pangasius farmers to move towards more sustainable production practices. More than half of all production now originates from larger farms certified against third- party audit environmental and social standards (e.g. ASC, GLOBALgap, GAA).
There are currently more than 140 processing establishments certified to export to the EU, whilst in 2010 there were 291 pangasius exporters two-thirds of which had exports volumes of less than 1,000. The remaining larger exporters contribute almost 75% of the total export volume. The EU and USA are the most important markets for pangasius. Nearly all pangasius is exported as IQF and block-frozen fillets; less than 1% of export volume are value-added products. Controversially some EU supermarkets are known to retail de-frosted frozen as fresh fillets! The value of pangasius exports to the EU have decreased since 2008, possibly as a result of stronger competitiveness in the European whitefish market during the past few years, whilst negative perceptions of the product among certain buyers and consumers also present a challenge to the sector.
Introduction
This report constitutes Deliverable 3.1 ‘Description of value chains & input-output structure’ of the EU Horizon 2020 funded ‘Primefish’ Project (2015-2019; [www.primefish.eu] ) assessing competitiveness of European fisheries and aquaculture in global markets. Task 3.1 (Box 1) lead by the University of Stirling, is conceived as the first of four inter-linked elements of a competitiveness assessment based on the Global Value Chain Analysis Framework (see T3.4 Deliverable Protocol). The other linked WP3 tasks are T3.1 value chain descriptions, T3.2 value chain governance, T3.3 market based governance, T3.4 Industry dynamics, opportunities and threats and WP4 T4.1 product innovation case studies.
Task 3.1: Description of value chains for species/country systems (see Table 1) from point-of-production to sale covering channel intermediaries to major European consumer markets (supply, processing distribution). Assessment of market dynamics i.e. form dominance of processing, wholesale and retail outlets, concentration and capitalization of the industry at various nodes. The input-output structures assessed for specified value-chains.
The report is a synthesis of 17 individual value-chain reports,
Table 1. Species-country value chain case studies and responsible institution
| SN | Species | Country | Institution | SN | Species | Country | Institution |
|---|---|---|---|---|---|---|---|
| 1 | Salmon | Norway | Kontali | 10 | Cod | Canada | Memorial |
| 2 | UK | UoS | 11 | UK | UoS | ||
| 3 | Faroes | Syntesa | 12 | Norway | Nofima | ||
| 4 | Trout | Denmark | Alborg | 13 | Iceland | U. Iceland | |
| 5 | Italy | Parma | 14 | Herring | Iceland | MATIS/ U.Ice | |
| 6 | Turkey | Kontali | 15 | Norway | Nofima | ||
| 7 | Sea bass/bream | Spain | CETMAR | 16 | Germany | TTZ | |
| 8 | Greece | Kontali | 17 | Denmark | Alborg | ||
| 9 | Pangasius | Viet Nam | Nha Trang |
All reports are based on publicly available data, including European catch/production as well
as import and export to and from the EU. The original source reports are available on the PrimeFish
website ( [1] ).
This report separately describes the main material flow in the supply chain (input-output structure) for the six commodity species (or species groups) that are the focus of PrimeFish; four farmed and two capture: (i) Atlantic Salmon, (ii) Rainbow Trout, (iii) European Sea bass (Dicentrarchus labrax) and gilthead sea bream (Sparus aurata) (iv) Pangasius catfish (Pangasius hypophthalmus) (v) Atllantic Cod (Gadus morhua) (vi) Atlantic Herring (Clupea herrengus). The latter two species are selected as examples of demersal and pelagic fisheries. Sea bass and sea bass are treated as a single group as almost perfect substitutes, sharing very similar production and post-harvest value-chain characteristics.
The value chain mapping for each species covers catch and harvesting as well as value-addition through the various stages of processing, distribution, retail and food-service, where data was available. Results for each species (group) are synthesised across the following value-chain headings: (a) farmed production or landings (b) imports (c) processing (d) export (e) consumption. Each species-section then concludes with a summary of the main VC attributes with findings contrasted between countries.
Results will form the sample frame/design for the subsequent micro level mapping of different product categories of the chosen species for key market segments (niche and commodity, local, European/international).
Atlantic cod
Introduction
Four countries with particular relevance to Atlantic cod supply in Europe – Norway, Iceland, the UK and Canada – will be analysed in the sections below. While Norway and Iceland are major global suppliers of cod (see Table 2), the UK is a main consumer country in the EU, where significant level of value addition also occurs.
Table 2. Top 10 producers in 2014 (quantity). Source: FAOSTAT 2016
| Top 10 producers | Quantity (t) | Share of global production (%) | |
|---|---|---|---|
| 1 | Norway | 473.6 | 34.5 |
| 2 | Russian Federation | 438.0 | 31.9 |
| 3 | Iceland | 237.8 | 17.3 |
| 4 | Faroe Islands | 36.4 | 2.7 |
| 5 | United Kingdom | 30.6 | 2.2 |
| 6 | Greenland | 30.5 | 2.2 |
| 7 | Denmark | 22.3 | 1.6 |
| 8 | Spain | 18.7 | 1.4 |
| 9 | Poland | 18.3 | 1.3 |
| 10 | Germany | 15.2 | 1.1 |
| 11 | Canada | 13.0 | 0.9 |
| EU28 | 140.3 | 10.2 | |
| World | 1373.5 | 100.0 | |
In general, the EU is a small producer of cod, reliant on imports from main producer countries. As Table 3 reveals, the combined share of the EU20 in harvesting of cod only amounted to 10.2% in 2014, while Norway and Iceland together produced more than half of the world production. Currently, the influence of Canada on the EU market is very limited due to the small volume of cod harvest. However, there is indication that the cod stocks may be exploitable again in the near future which may mean that Canada could become a more significant supplier of cod to the EU in the future.
Table 3. Production in PF countries (000 t). Source: FAOSTAT 2016
| 2000 | 2001 | 2002 | 2003 | 2004 | 2005 | 2006 | 2007 | 2008 | 2009 | 2010 | 2011 | 2012 | 2013 | 2014 | Change 2000 - 2014 | |
|---|---|---|---|---|---|---|---|---|---|---|---|---|---|---|---|---|
| World | 940 | 945 | 903 | 849 | 899 | 850 | 834 | 784 | 771 | 868 | 952 | 1052 | 1114 | 1359 | 1373 | 433 |
| EU28 | 214 | 204 | 163 | 141 | 151 | 125 | 125 | 117 | 119 | 127 | 140 | 142 | 150 | 142 | 140 | -74 |
| Norway | 219 | 209 | 228 | 217 | 231 | 226 | 221 | 218 | 215 | 244 | 283 | 340 | 358 | 471 | 474 | 254 |
| Iceland | 238 | 240 | 213 | 206 | 227 | 212 | 199 | 174 | 151 | 189 | 179 | 182 | 205 | 236 | 238 | -1 |
| UK | 42 | 33 | 32 | 22 | 21 | 20 | 21 | 19 | 19 | 23 | 26 | 23 | 26 | 29 | 31 | -11 |
| Canada | 46 | 40 | 35 | 23 | 25 | 26 | 27 | 27 | 27 | 20 | 17 | 13 | 11 | 11 | 13 | -33 |
Landings/supply
Iceland
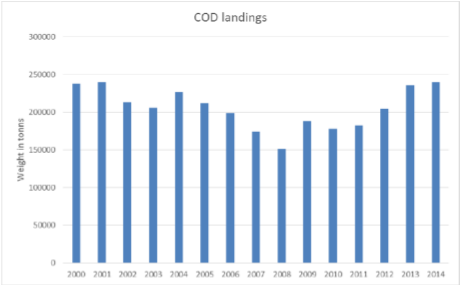
Supply of materials is mainly landings from Icelandic boats fished within the Icelandic exclusive fisheries zone. There have been some fluctuations in cod catches for the period 2000-2014, but the stock is quite strong now and catches in Icelandic waters have been over 200 thousand tonnes in recent years. In 2014, cod landings totalled 237,455 t, 6.7% from the Barents Sea and 93.3% from Icelandic waters, (see Figure 1).
Figure 1. Cod landings in Iceland, LWE. Source: Statistics Iceland
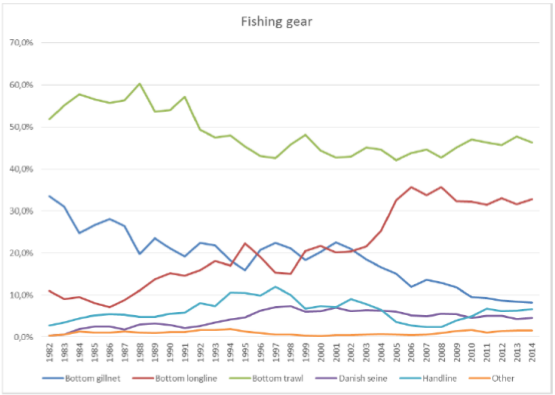
In 2014, the majority of cod was landed by Icelandic owned trawlers (45%), long-liners (33%), gill- netters (8%) operating in Icelandic Exclusive fisheries zone and small proportion from the Barents Sea. The proportion of cod landed by long line and gillnet has increased and declined to 33% and 8% respectively from having equal shares of about 20% in 2000, Figure 2. This is due to an increase in the demand for line caught fish as well as fresh fillets, which are of better quality when the fish is line caught and command a higher market price.
Figure 2. The total catch of cod by Icelandic boats by major fishing gear since 1982. Source: Statistics Iceland
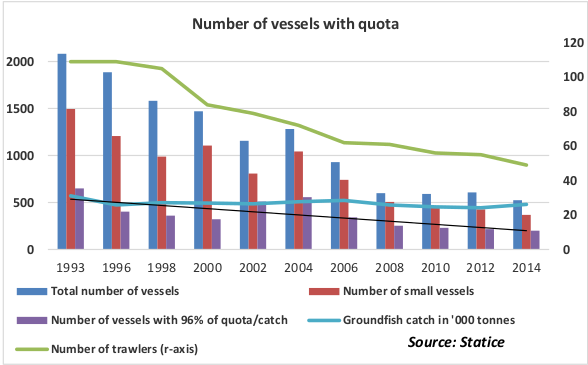
The number of freeze trawlers has declined from 35 in 2000 to 15 in 2014, because of better economic viability for fresh products, processed on land, high labour cost for freeze trawlers, higher levy for freeze trawlers compared to fresh fish trawlers. Figure 3 present the development in the Icelandic fleet from 1993 to 2014. Between early 1990s and 2014 the number of all vessels has fallen by 60% - the number of trawler by half and medium sized vessel by three quarters.
Figure 3. Development in the Icelandic fleet
From the introduction of the quota system the profitability of the sector has increased. The trend has been that the companies are getting bigger and fewer. The 50 biggest companies in this sector have around 87% of the total quota while ten the biggest have around half the quota. At the beginning of the fishing year 2016/2017, which runs from September 1 st to August 31 st , the biggest companies were HB Grandi with 10.9% of the combined catch share in all species, Samherji Iceland with 6.2% and Thorbjorn with 5.1%.
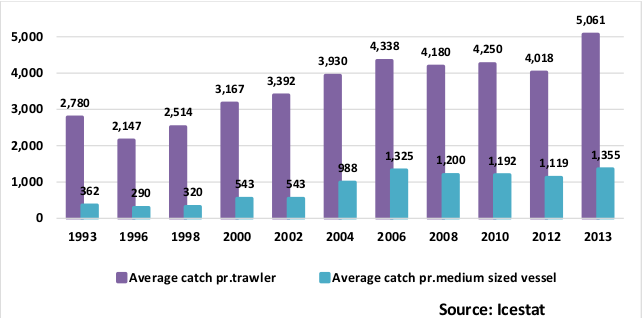
In the same time as the number of vessel have declined the average catch per vessel have increased as can been seen from Figure 4. Average catch per trawler have more than double from early 1990 to 2013. In the category of medium size vessel, the average catch was nearly three times larger in 2013 than in the 90s.
Figure 4. Average catch per vessel (tonnes)
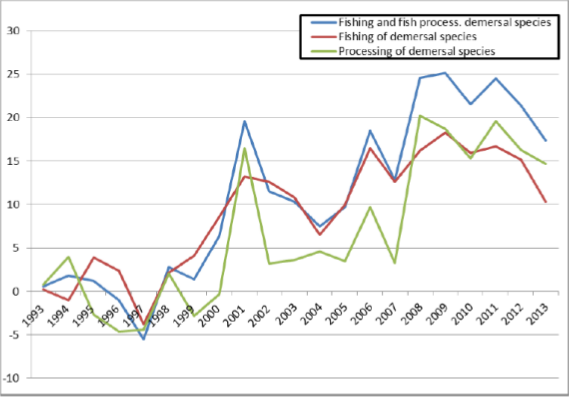
Figure 5 shows the profitability of the consolidated industry, on average net profit of the industry has been 6.1% of total revenues. Only in 1997 and 1999 did the industry lose money, 1.4% in 1997 and 1.3% in 1999. The figure indicates as well, that the profitability of the industry has been improving in recent years. Every year since 2001 the profit of the fishing industry as a whole has been above 5% of revenues, but between 1993 and 2000 the profitability of the industry was never above 5%. The best years were 2001, when the profit of the industry was 18.1% of revenues, and 2006, when the profit was 16.9%. The reasons for the increased profitability of the industry are mainly twofold, increased productivity and higher prices.
Figure 5. Net profit in fishing and fish processing, 1993-2013. Matis
Norway
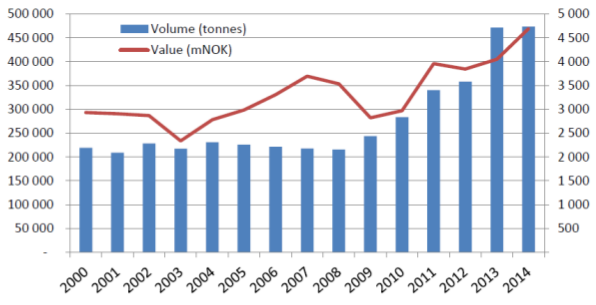
Cod is the most important species in Norwegian commercial fisheries, with about 1/3-of total catch value. The fleet fishing for cod is also the most numerous, with about 3 500 vessels. The Norwegian catch of cod has been steadily increasing since 2008 and reached about 470,000 t in 2014, due to favourable resource situation and TACs reaching all time high levels, Figure 6. Of this 98% of was caught in the Barents Sea (ICES I) and the Norwegian Sea (ICES IIa) and within the waters of Spitzbergen and bear Island (ICES IIb) and 78% of which from within the Norwegian EEZ.
Figure 6. Norwegian catch of cod (tonnes) and corresponding ex-vessel value (mNOK, in nominal prices), 2000-2014. Source: Norwegian Directorate of Fisheries and Statistics Norway
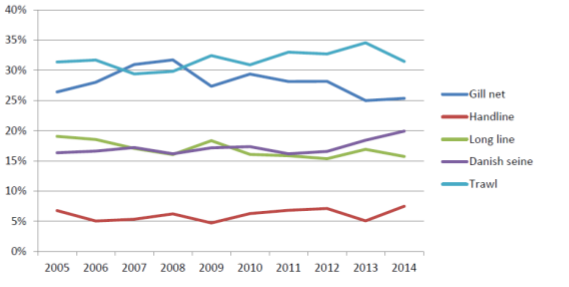
Even though most demersal vessel catch cod as their main species (except for off shore conventional vessels) most of them are involved in multispecies fisheries most often including saithe and haddock as well. For many trawlers also shrimp is targeted. The most common gears used in this fishery in 2014 is trawl (30 %), gill net (25 %), Danish seine (20 %), long line (16 %) and hand line (7 %), with relatively stable development in the shares latter ten years, despite the mentioned doubling of the catch from 2005-2014, Figure 7.
Figure 7. Gear use development in Norwegian cod catches, 2005-2014. Source: Norwegian Directorate of fisheries.
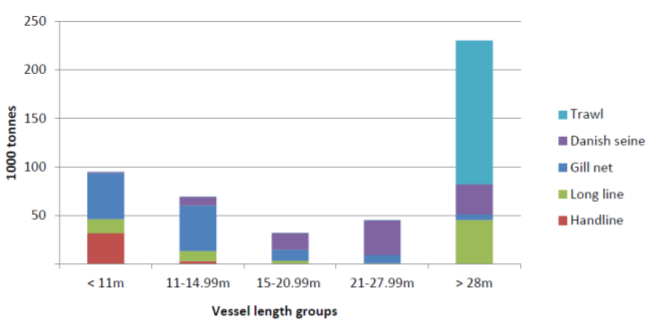
The distribution of gears in fleet segments of different length – in which the division between off- shore and coastal vessels traditionally have been 28 meters. Gill nets are the most employed gear among smaller vessels (<15m) while trawl and long line (auto) dominate among the largest (off- shore) vessels (>28m). Danish seine is the main gear among the larger coastal vessels (15-28m), Figure 8.
Figure 8. Norwegian cod catch in 2014 by vessel length and gear use. Source: Norwegian Directorate of fisheries
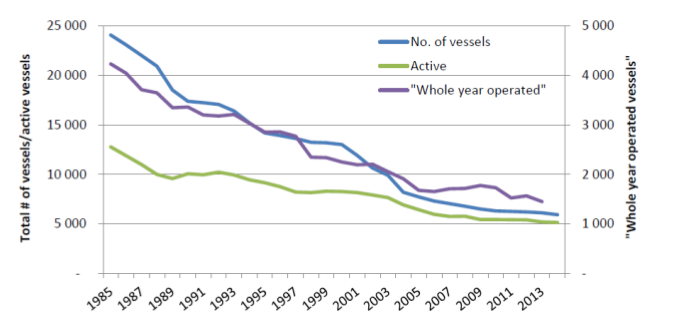
The Norwegian fishing fleet has undergone vast changes in size the later 100 years, a development pacing speed in recent years as resources have become more scarce, technology more effective and – therefore – authorities have been forced to phase in regulations to secure it’s sustainability. Since 1985 the fishing fleet (number of registered fishing vessels) is reduced by more than 3/4, and since the start of the millennium by more than the half (- 54 %), Figure 9. While the quantities of cod landed by the Norwegian fleet have been increasing, the fishing fleet has contracted during the last 15 years, indicating increased productivity.
Figure 9. The Norwegian fishing fleet, 1985 – 2014; number of registered fishing vessels, active fishing vessels and whole year operated vessel. Source: Directorate of Fisheries, Norway
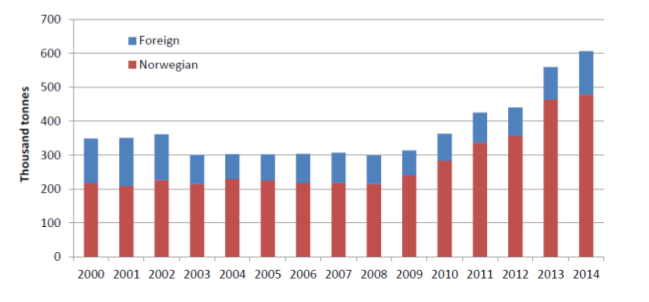
The Norwegian first hand market does not only include cod landed by Norwegian vessel. The figure below displays the Norwegian cod landings in the period 2000–2014, together with the cod landings in Norway from foreign vessels, Figure 10.
Figure 10. Cod landings in Norway (LWE) from Norwegian and foreign vessels – 2000-2014. Source: Directorate of Fisheries, Norway
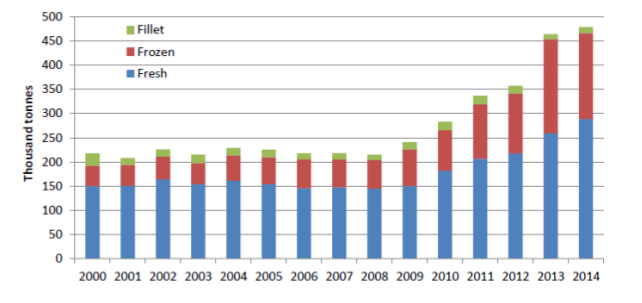
The cod landings from Norwegian vessels in the period 2000–2014 are displayed with respect to the state of the raw material; fresh or frozen or on-board processed (i.e. cod fillets). This has of course great significance for which value chains the raw material can enter (and which processing facilities can utilise the cod), Figure 11. Until 2009, with stable quotas, the share of landings landed frozen was stable at about 27–33 per cent (fillets included) of the total. In later years (after 2008) the share of frozen landings has increased considerably. While total landings increased with 120% in the period 2008–2014, frozen landings increased by 200 per cent, fillets increased by 15 per cent while the volume of fresh cod landings were doubled.
Figure 11. Norwegian cod landings – fresh, frozen and fillets – 2000-2014, LWE. Source: Directorate of Fisheries.
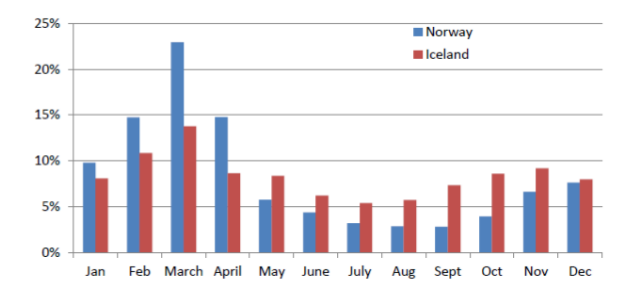
One striking characteristic with Norwegian cod landings is the seasonality of landings, especially when comparing with Iceland, Figure 12 . Large quantities of the cod are caught during the first months of the year. In general, this is explained by the spawning migration of the cod, where it migrates from the Barents Sea to the Lofoten islands. In addition the fleet composition and quota distribution, where large quantities are reserved for the coastal vessels, vouches for this result. Below, the monthly catch shares of cod are illustrated for the period 2000–2014, and highlighted against the same in Iceland. With a value chain that demand a high degree of continuity in supply, too big seasonality in supply will represent a great obstacle for the chain. It can be argued that the global trade of fish today, led by multinational retail chains, is characterised by the need for continuous supply.
Figure 12. Seasonality in landings – monthly catches as share of total – Norway and Iceland, weighted average. Source: Directorate of Fisheries and Statistics Iceland
Canada
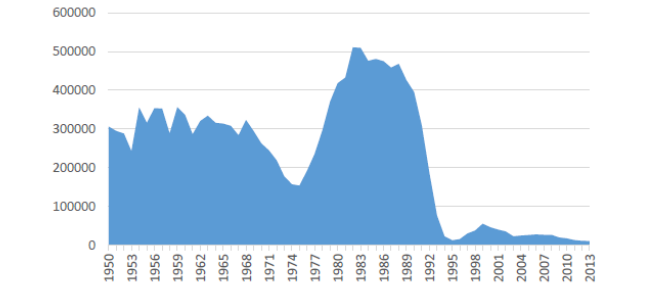
Historically, the Canadian cod fishery has played a major role in the global supply of white fish. Landings peaked at 810,000 t in 1968, 80% of which by harvested by foreign vessels. Landings of cod in Canada by the Canadian fleet have historically been above 300,000 t /year. However, due to overfishing the fishery collapsed in early 1990s and moratorium was announced on the commercial northern cod fishery. Since then landings have been below 50,000 t/ year, Figure 13. Canadian landings of cod in 2012 were 12,263 t or 1.1% of the global landings of cod for the same year.
Figure 13. Atlantic cod landings in Canada, tonnes LWE. Source: FAO 2014
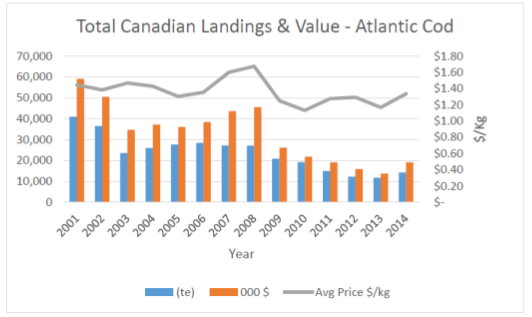
Between 2001 and 2014 total landings and value have decreased from 40,913 t (€41 million) to 14,261 t (€12 million). Despite that the average price has remained relatively stable at about €0.90/kg over the same period, Figure 14.
Figure 14. Total landings and value (in Canadian $) of Atlantic cod in Canada (DFO 2015)
About 70% of Atlantic cod currently harvested in Canada is captured in Newfoundland and Labrador. In 2015, 71% (6,493 t) of the total cod harvest was landed by boats of length <35’ (10 m), underlining the current small-scale nature of the fishery (Table 4).
Table 4. Newfoundland Atlantic cod landings by vessel length. Source: Fisheries and Oceans Canada.
| Vessel length | Landed RW Cod (Kg) | % Landed by Vessel type (Length) | # of Vessels | Kg/Vessel |
|---|---|---|---|---|
| < 35' | 6,493,372 | 71% | 2,212 | 2,936 |
| 35-44' | 1,877,298 | 20% | 300 | 6,258 |
| 45-54' | 427,566 | 5% | 38 | 11,252 |
| 55-64' | 394,399 | 4% | 50 | 7,888 |
| Total | 9,192,635 | 100% | 2600 | 3,536 |
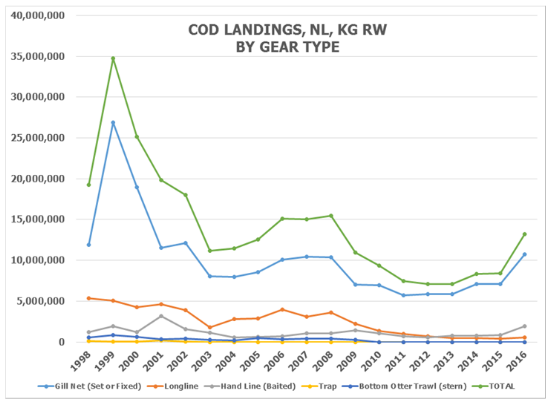
Correspondingly, the vast majority of fish were caught using gillnet, followed by hand line and longline, Figure 15.
Figure 15. Atlantic cod landings in Newfoundland by gear type. Source: MemU
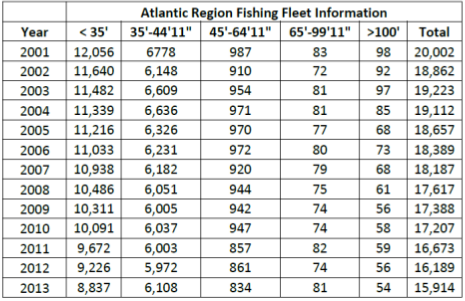
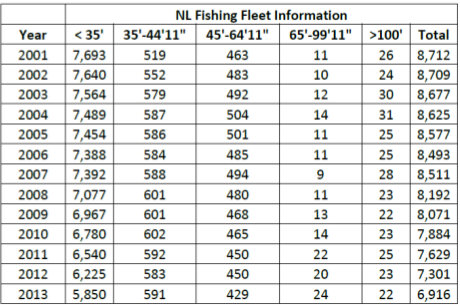
Canadian catches of cod are landed primarily as fresh fish by the inshore/nearshore fleet destined primarily for primary processing, local retailing and export. However, there is a small by-catch of cod harvested by the offshore fleet which is landed frozen. There is an indication that the cod stock may be recovering, and a significant investment in the fishing fleet may be required in order to be able to exploit it. Employment in the harvesting sector in NL has declined by about 60% in the period 2001-2014 and reached 3,100 full-time equivalent jobs in 2014, complicated by aging workforce. Canada’s fishing fleet is divided into two regions, Atlantic and Pacific representing the east and west coasts of the country, respectively. The fleet is further categorized by overall vessel length. Since 2001, the national fleet has decreased by 21% (4,909 vessels) from 23,361 vessels (2001) to 18,452 vessels (2013). The majority of the fleet reduction has occurred in the Atlantic fishing fleet, Table 5, which decreased by 4088 vessels (83% of the national decrease) with Newfoundland and Labrador (Table 6), accounting for 37% (1796 vessels) of the total decrease in the national fleet size. The reduction in the fleet size has mainly occurred in the <35’ and 45’64’11” fleet segments. The fleet is predominantly composed of vessels <35’ vessels (9854 in 2013) followed by vessels in the 35’-44’11” (7119 in 2013) category, which together make-up 92% of the national fleet.
Table 5. Atlantic region Fishing Fleet Information. Source: Fisheries and Oceans Canada, Regional Offices, Licensing Units
Table 6. Newfoundland and Labrador Fishing fleet Information. Source: Fisheries and Oceans Canada, Regional Offices, Licensing Units
UK
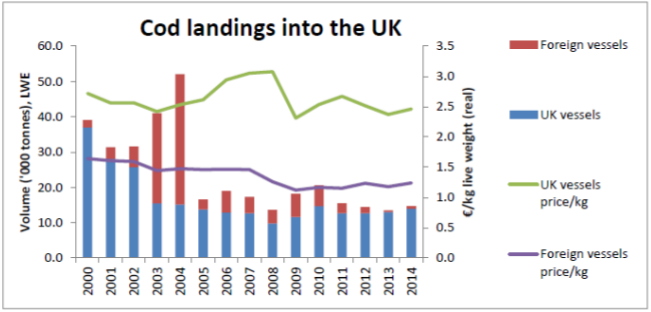
The majority of cod landed into the UK by British vessels was captured in the North Sea (ICES area IV). The total landings of cod into the UK amounted to 14,700 tonnes LWE, of which foreign vessels landed 700 tonnes (considered import). For comparison, in 2000 the total quantity of cod landed in the UK was 39,100 tonnes LWE, Figure 16. The decline in landings of demersal fish has a number of causes, including reductions in fleet size, declining fish stocks and restricted fishing opportunities. EU and UK regulation has limited demersal fishing activity in recent decades, through decommissioning of fishing vessels, reductions in quotas and fishing effort limits and other provisions of stock management plans. The cod quota for UK vessels was 28,988 tonnes for 2014 with UK vessels landing 14,900 tonnes of cod abroad (which is roughly equivalent to the landings in the UK) with a value of €25 million. The largest amounts of demersal fish (incl cod) landed abroad by the UK fleet were into the Netherlands and Norway (17 and 10 thousand tonnes respectively).
Figure 16. Cod landings into the UK by UK and foreign vessels and prices achieved. Source: DEFRA
The average price of cod landed by UK vessels was €2.47/kg whereas foreign vessels achieved an average price of €2.12/kg. France tops the list of foreign vessels landing into the UK, with 17 thousand tonnes of demersal fish. A large majority of demersal fish landed by UK vessels in 2014 were caught using demersal trawls and seines. Price differentials are also observed between different gears of the same class. This variation in prices partly reflects the different species caught by different gears. There can also be a premium attached to the method by which the fish are captured.'
Imports
UK
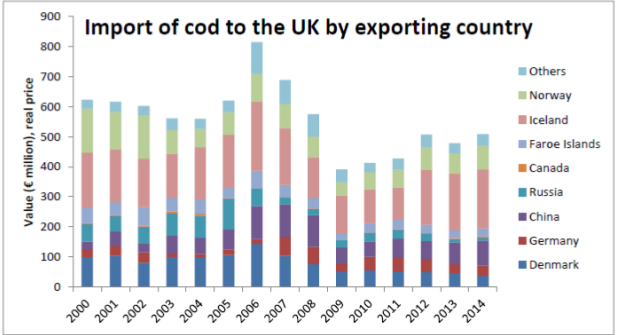
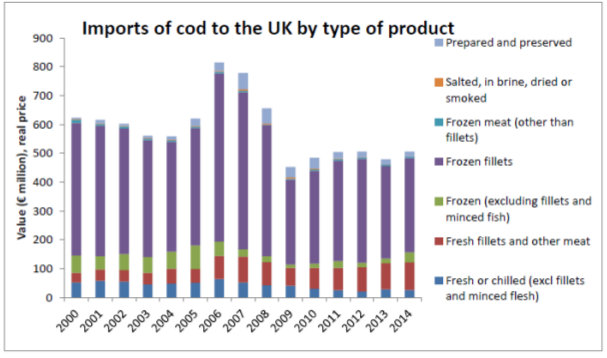
The UK is a net importer of cod. For the period 2000 -2014, UK imports of cod ranged between about 100,000 and 140,000 tonnes product weight per year, with a total value of between €400 and €800 million. In 2014 the imports of cod to the UK was 116,300 tonnes product weight (16% of all fish imports by volume) equivalent to around 295,000 tonnes live weight. In 2014, arrivals from EU member states comprised 20% of the total cod import by volume. Of those, Germany and Denmark accounted for about 70%. For the period 2000-2014 the share of those two countries has ranged between 54% and 86%. In 2014, of the non-EU exporter countries Iceland alone accounted for more than a quarter of all cod imports by volume and value in 2014. Other major countries were China and Norway, Figure 17. In 2014, 78% and 73% of the volume and value of imported cod products into the UK were frozen products, Figure 18. Of those, 64% and 65% of the volume and value respectively of total cod imports were frozen fillets. Frozen fillets have remained the top cod import product by volume for the period 2000- 2014. In 2014 the average price of imported frozen fillets was €4.38/kg, similar to 2000. Fresh fillets achieved the highest average price of €8.39/kg.
Figure 17. Value of cod Imported to the UK by exporting country 2000-2014. Source; HM Revenue & Customs
Figure 18. Value of cod imported to the UK by type of product: 2000-2014. Source: HM revenue and Customs
Canada
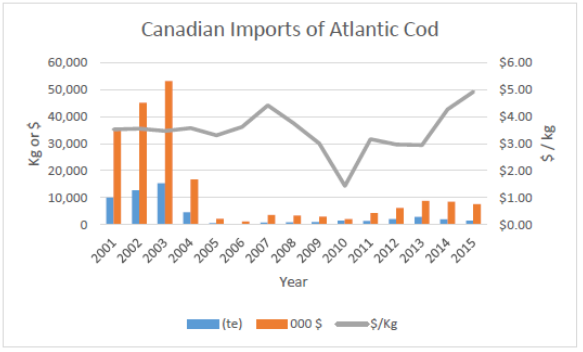
Due to limited domestic supply, Atlantic cod is also imported into Canada for further processing (and re-export) and to supplement domestic markets. Imports of Atlantic Canada decreased from over 15,000 tons valued at $53 million CDN (€33 million) in 2003 to 1,989 tons worth $8.5 million CDN (€5.6 million) in 2014 (Statistics Canada, International Trade Division, 2015), Figure 19. The import price has fluctuated from as low as $1.44/Kg (€1.02/Kg) in 2010 up to $4.92/Kg (€3.49/Kg) in 2015.
Figure 19. Canadian imports of Atlantic cod. Source: Statistics Canada, International Trade Division
Processing
Iceland
Fish processing has undergone significant consolidation in the last two and a half decades, resulting in greater economy of scale and scope. Together with investment in modern equipment and processing technologies, this trend has improved productivity and the overall competitiveness of the industry. Productivity in the seafood industry has been increasing and in 2013, each job in the industry accounted for double the value it did in 1997, measured in fixed prices. Overall productivity has gone up by 130% since the early 1990s. Productivity growth can be attributed to increased automation, both in the fishing and processing sectors, increased share of value added products in the exports and a change to processing on land where a better utilisation of the raw material can be achieved.
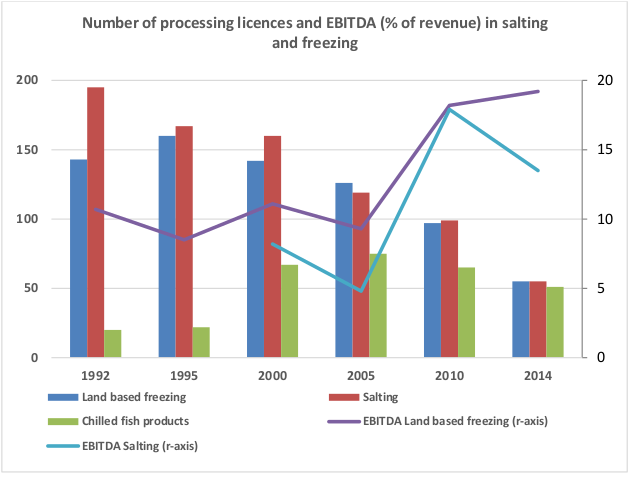
In 2014, there were slightly more than 200 processing licenses, but they were twice as many in the early 1990s, Figure 20. The development towards fewer processors has been most pronounced in salt-fish processing, where the number of active firms has decreased by nearly 75%. Similarly, the number of freezing plants was down by 60%. Only fresh fish processing plants experienced an increase, of about 150%. The average size of the remaining plants, however, is larger than what it was 25 years ago.
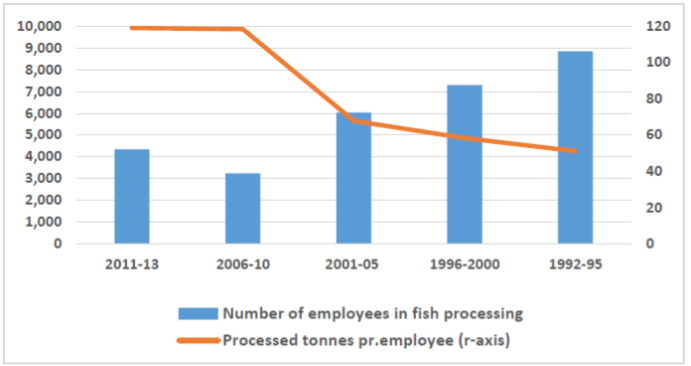
The workforce employed in fish processing declined by 60% from mid-1990s to latter half of 2000s. However, employment has started to rise again in recent years, driven by increasing share of processing of fresh fish products and increasing volume of pelagic species being processed, Figure 21.
Figure 20. Number of processing companies in Iceland. Source: Statistics Iceland and Mast
Figure 21. Number of employees in processing and productivity 1992- 2013.
Traditionally nearly all demersal wet fish was allocated to freezing, salting or iced whole for export. This changed with the emergence of freezing trawlers in the 1980s. Since mid-1990s, around one- third of wet ground fish has been frozen at sea but land based freezing fell from 45% in 1990 to about 35% on average in 2010-13. These changes in processing of demersal fish in Iceland occur in the allocation to salting that was increased temporally to 25% in 1996-2000 but has fallen to 16%- 20% in the recent years. Another significant change since mid-1990s has been the rapid increase in allocation to chilled products to near one-fifth in 2014 up from a very low level in the 1990s.
Processing in chilled products has increased in accordance to decreasing production of frozen and salted products. Chilled products are now the most important export category of processed demersal in Iceland or 30% in value in 2014 (this reflects the high value added level of fresh fish that 20% of wet-fish is processed fresh but generates 30% in export value).
Norway
Naturally, the Norwegian cod processing industry, caretaking volumes in levels up to 450 000 tonnes annually throughout a long coastline, is one consisting of many units. We find 152 companies in the whole whitefish processing industry in 2013. The size of companies are varying to a large degree. From large whitefish filleting companies, to smaller companies in other branches employing just a few persons out of the season.
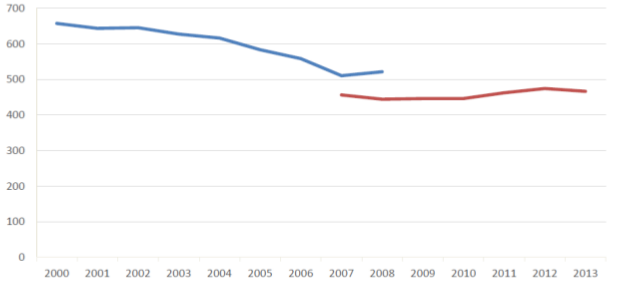
From Figure 22 we see that the total number of establishments have been reduced by nearly 200 in the period, from about 660 establishments in 2000. The largest reductions came prior to 2007 (holding the break in the time series outside) while in later years there has been a small increase in number of fish processors. The reduction in number of establishments in the whole period is 29 %.
Figure 22. Number of establishments “Processing and preserving of fish and fish products” (blue line) and enterprises in “Processing and preserving of fish, crustaceans and mollusc” (red line) in the period 2000-2013. Source: Statistics Norway
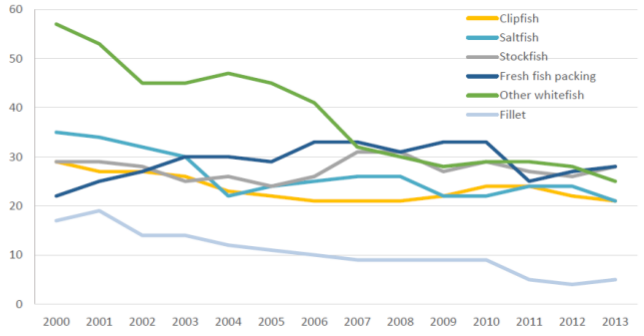
In Figure 23 the number of firms within the different branches of the whitefish processing industry is depicted over the 2000–2015 period. We only include the six traditionally largest branches, constituting the lion’s share of the industry. By doing so we leave out multi sectorial companies (also caretaking other fish than whitefish), companies who is hired to produce for others, landing stations (packing and transporting fish to other purchasers) and minced seafood production.
Figure 23. Development in the number of companies within different whitefish sectors, 2000-2015
Notably, all sectors/branches have undergone reductions in number of companies. The reduction in single branches need not be due to closure or bankruptcy among companies, but can also stem from a change in the companies’ product mix, redefining them into another branch. However, the overall reduction in companies – from 213 in 2000 to 142 in 2013 – indicates fewer and larger companies, especially by the increase in the cod quota.
The largest reduction – in absolute figures – is within the branch “Other whitefish producers” indicating a trend of specialisation in the population. This specialisation assumption is supported by the development in number of multi sectorial companies which has gone down with 56 per cent (from 16 to two companies), constituting the lion’s share of the light blue line in the period. The largest relative decrease takes place among the fillet freezing plants, which is reduced by 70 per cent – from 17 in 2000 (19 in 2001) to 5 in 2005. One reason is that one of the largest whitefish companies in Norway – Norway Seafood ASA – merged all their firms, including four filleting firms, into one company in 2011. This branch has struggled with low profitability over years. One reason has been the exposure of new competition from Chinese producers among others. To some degree, the filleting branch has surpassed this increased competitive pressure by shifting the product mix from frozen to fresh fillets. However, high Norwegian labour costs level creates severe problems for a highly labour intensive production like this. New technological developments are present in this branch but have not kept the pace with the increase in labour costs the latter decades. The number of conventional product companies – clipfish, saltfish and stockfish – is down by 1⁄4 in the period – from 93 to 70 companies, which is a relatively small decrease, compared with the other branches. The decrease among stockfish companies is the smallest (- 10 %), while the number of clipfish and saltfish companies are reduced by 24 and 31 per cent, respectively. The clipfish and stockfish branches are those most often mentioned as sectors with satisficing long-term profitability in this industry – opposite of for instance the whitefish fillet branch – but with large inter-year variations. While the stockfish branch follow an ancient recipe for their production, serving traditional markets with few product innovations, the clipfish industry has undergone rather huge technological developments where technology has replaced labour later years. Moreover, this is perhaps the only (at least most successful) Norwegian fish-processing branch that has implemented sea-frozen raw material in their production. By doing so they have enabled an input-throughput-output paradigm that is isolated from the supply uncertainty surrounding fresh fish supply (due to seasonality, weather and other causes), and become a highly efficient industry resting on economies of scale.
Saltfish producers seems to operate under more fierce completion, not safeguarded from the severities in the first hand market. This branch has experienced lower profitability over time and also greater downsizing of the company population. The only branch of companies that have increased in numbers throughout this period are the fresh fish packers. In 2000, there were 22 companies, increasing to roughly 33 in 2006–2010, before falling back to 28 in 2013. The latter increase can be due to the ‘extreme’ increase in the cod quota, while the period with the most companies can possibly be explained by the quota stability.
One persisting disadvantage for the Norwegian fish processing industry in Norway in the last 20 years, relative to competitor countries, is the extra-Norwegian labour cost level. The hourly wage in the Norwegian industry is at a level that is 6 times higher than in Poland, 61 % above UK and 37 % above France. With capital costs at a historical low level, automatization has become a necessity and a possibility. One efficiency increasing innovation, which has taken place in this industry in later years, is the establishing of dedicated gutting and grading lines for fresh fish landings from the coastal fleet. This has led to a great relief in the workload for the fishers, who no longer need to gut the fish – neither on board nor on land.
Canada
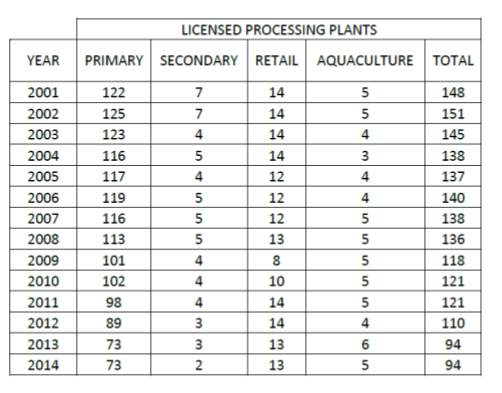
The processing capacity in NL has been decreasing, from 148 in 2001 to 94 in 2014 (Table 7). Error! Reference source not found.Most plants are multi-species and have dedicated processing lines per species. The majority of the processing capacity is in the primary processing sector, accounting for about 80% of the total production in NL. Secondary processing contributes only 2% of the total processing capacity in the province. In order to ensure that fish landings benefit not only harvesters but also processors, a minimum processing requirement has been applied by regulation to all fish intended for sale outside the province. For ground fish (including cod), the minimum requirement is that it must be filleted or split and salted.
Table 7. Licensed processing plants in NL. Source: Fisheries and Oceans Canada
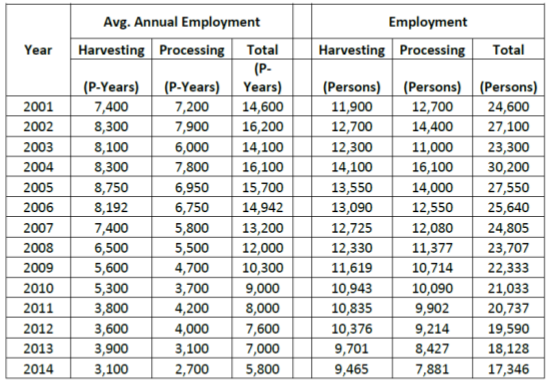
Equivalently, the employment in the processing sector has declined by about 60% in the period 2001-2014, reaching 2,700 full-time equivalent jobs in 2014, Table 8.
Table 8. NL fishing industry employment. Source: Department of fisheries and Aquaculture.
UK
In 2014, there were 403 fish processing units in the UK providing a total of 19,511 FTE (full time equivalent) jobs, of which the sea fish (i.e. saltwater or seafood) units were 83% (333) providing 73% (14,305) of the FTE jobs.
The sector has contracted in recent years, with a 34% reduction in the number of units and a 12% reduction in the number of FTE jobs between 2008 and 2014. Average unit size, in terms of employment, grew by 33% over the period, to 43 FTEs per unit in 2014.
In 2014 47% of sea fish processing units were small (each providing between 1 and 10 FTE jobs) and these processors provided 6% of industry employment. 60% of FTE jobs were concentrated in the 11% of units with 101+ FTEs each. In the same year 56% of sea fish units were mixed processors (i.e. undertaking both primary and secondary processing); 29% were primary processors and 15% were secondary processors. There is evidence of a recent rebound in the number of units undertaking secondary and mixed processing, while the number of primary processors has continued to decline. The composition of units by fish type category has remained relatively stable: 48% mixed species; 24% shellfish; 23% demersal (whitefish) and 5% pelagic (2014 figures).
The regional distribution of the industry since 2008 shows signs of further industry concentration in the two largest centres of Humberside and Grampian, which together accounted for 38% of units and 52% of FTE jobs in the industry in 2014.
The level of market share concentration in the UK seafood processing industry is considered low, as the top two players in the industry account for only 28.1% of total industry revenue in 2013. While the industry remains fragmented for now, the present trend is towards consolidation, and market share concentration is increasing year on year.
Between 2008 and 2012 industry turnover increased by 16%, while operating costs increased by 20%, resulting in a 24% drop in operating profit. Industry operating profit margin was an estimated 7% in 2012. The reduced profitability of the seafood processing industry in 2012 appears to have been driven by higher raw material costs, which were not fully passed on to customers
Export
Iceland
In 2014 the total export of the Icelandic seafood industry is around about 245 billion Icelandic krónur (ISK), roughly equal to 1.57 billion Euros. The export of cod products is around 578 million euro or 37.6% of the total value of the export of seafood products from Iceland.
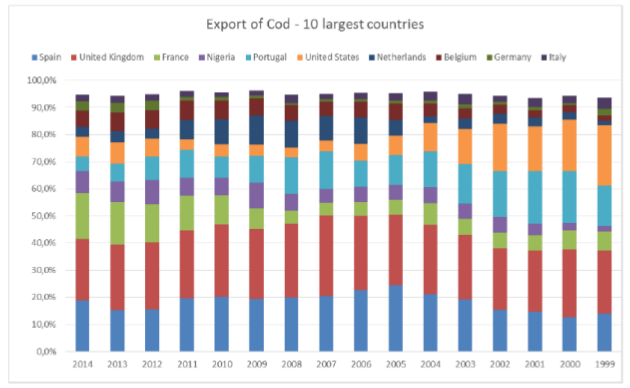
The ten largest countries for cod products accounts for over 93% of the total export value for cod from Iceland. The most important export countries for cod product before 1999 were US markets for frozen products, Figure 24. After the EEA agreement in 1994 the importance of EU markets has increased. As can been seen the most important country for cod export is UK with around 22.3% of the total values. Nigerian markets have been increasingly important for cod by-products such as dried heads and bones, but that market is now struggling because of low oil prices and unstable infrastructure. Britain is getting less important, whereas Belgium has been a growing market. The French market is dominating the export of fresh cod loins.
Figure 24. Export value of cod from Iceland by 10 major countries. Source: Statistics Iceland
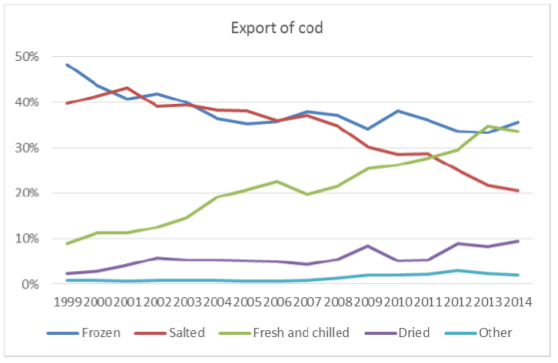
As can be seen from Figure 25 the export of cod products has changed a lot since 1999 when frozen products accounted for 48.3% of the total value of cod products. In 2014, frozen products is down to 35.6%. In the same time fresh and chilled products has gone from 9% in 1999 to 33.6% in 2014. In 1999 the export was mainly whole fish while in 2014 it is more or less loin cuts and fillets. The share of salt fish export decreased from 39.7% in 2014 to 20.6% in 2014.
Figure 25. Export of cod according to production methods, % of value.
The increase of dried cod is interesting as it share has increased form 2.3% in 1999 to 8.4% in 2014. This increase can be traced to increase in production of dried cod head and bones or what is often counted as by-products.
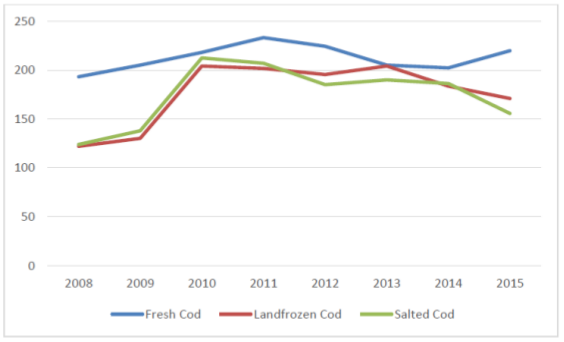
In Figure 26 the price development for the main cod production is demonstrated as index were the price of 2005 is equal to 100. Figure for fresh Cod are not available for 2006 and 2007 so they are not shown here. As can been seen the price index start to rice in 2009 and rice fast until 2010 for salted and frozen products. The trend from 2010 has been slow decrease in price but the fresh cod is starting to go up in 2014.
Figure 26. Price index of cod products, 2008 to 2015. Reference 4 quarter 2005 =100
Norway
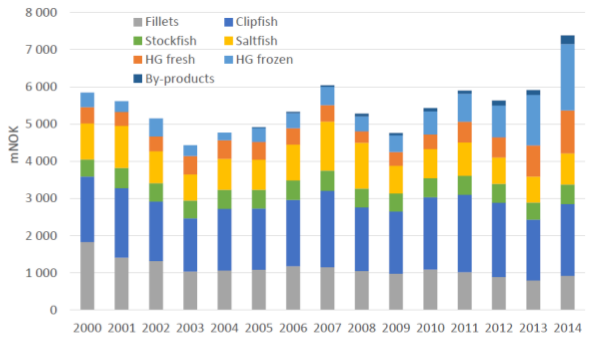
Figure 27 shows how Norwegian cod exports have been relatively stable in the period 2000 to 2013 – between 4.3 and 6 bNOK – while peaking in 2014 with 7.4 bNOK. In the “saltfish” product group saltfish fillets are included, constituting about 6 per cent of the total export value in the period (showing a negative trend). The product category “fillets” include both fresh and frozen fillets. The export value from frozen fillets is reduced by 2/3 in the period, while fresh fillets is 10 times as big in 2014 as in 2000. Hence the fresh share of fillets have increased from 2% to 40%.
Figure 27. Export value of different cod product categories, 2000-2012. Source: Statistics Norway
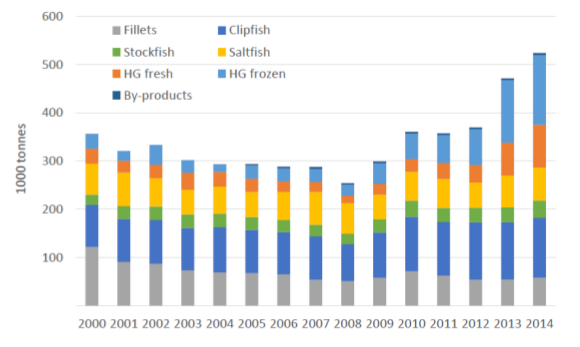
Figure 28. Norwegian exports of cod products, LWE, 2000-2014. Source: Statistics Norway
Figure 28 shows exports volume of cod. The reduction between 2000 and 2008 can be explained by Norway receives landings from foreign vessels. In 2014 foreign vessels landed 126 000 tonnes cod in Norway (Russian vessels responsible for 3⁄4). Second, warehousing of frozen fish can imply differences between exports and quotas each year. Third, a growing domestic market (relative to export) can explain some differences. Forth, and perhaps the most important factor, the crude conversion factors from product to live weight, can be too coarse for the different products, and technological improvements during the period can have rendered these factors misrepresentative. The most striking feature in the composition of the Norwegian export trade of cod is the increase in export of unprocessed goods. A more than doubled cod quota from 2008–2013 has led to a fivefold increase in the export headed and gutted (HG) cod.
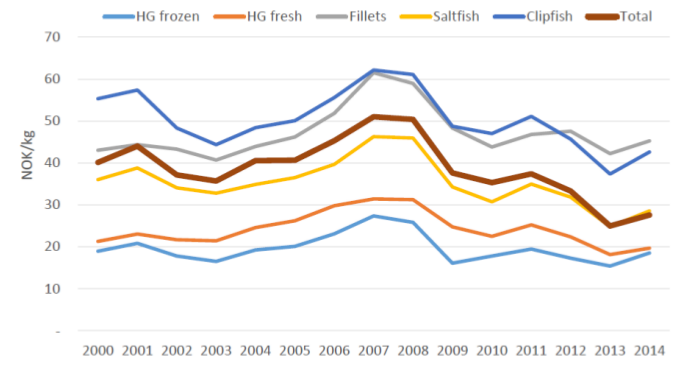
For traditional product categories from cod (clipfish, salt fish, dried fish and fillets) the export volume increase has been more modest, in the range of 15–65 %. Prices have fallen with about 1/3. Below we will look more into detail on the development of the different product categories within the cod export. Before doing that we present in Figure 29 the development in export product prices on the different cod export products. Price variations are to some extent easily observable during 2000–2014. The broad brown line represents the average price of all cod export, including stockfish and by-products, and reveals not only the price changes in exports but to some degree also the composition of the total export.
Figure 29. Export prices for main categories of Norwegian cod products (stockfish excl), 2000-2014. Statistics Norway
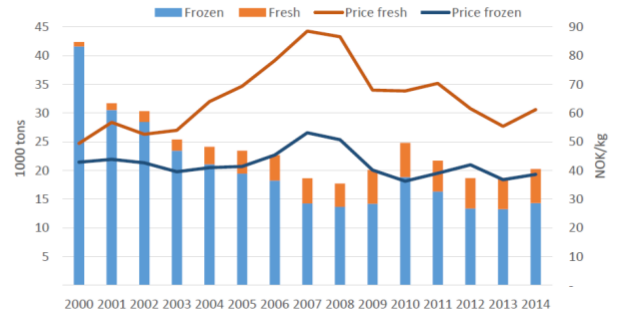
The general development shown in Figure 28 is relatively stable prices from 2000 to 2005, then an increase until 2008, before a decrease – with the financial crisis and increased quotas – until 2013, and an increase again until 2014 (which has prolonged Medio 2015). The graph above only draws the coarse picture regarding export prices. More details will be treated below when for each product. In 2014, the export of cod fillets was constituted of roughly 30% fresh fillet, 30% block frozen fillets and 40% of other frozen fillets. The price differences are great between the products. Block frozen fillets received NOK 29 per kg, other frozen fillets NOK 46 per kg, while the export price of fresh fillets where NOK 62 per kg (more than the double of the block frozen), Figure 30. The largest market for frozen fillets are Great Britain with about 45 per cent, before France (20 %). Most fresh fillets export goes to Denmark (76 %), while 10 % goes to France and 5 % to Sweden and UK, respectively. In the graph below, the only distinction is made between frozen and fresh fillets, showing volumes and prices in the period 2000–2014.
Figure 30. Export of fresh and frozen cod fillets from Norway, volume and price (FOB), 2000-2014
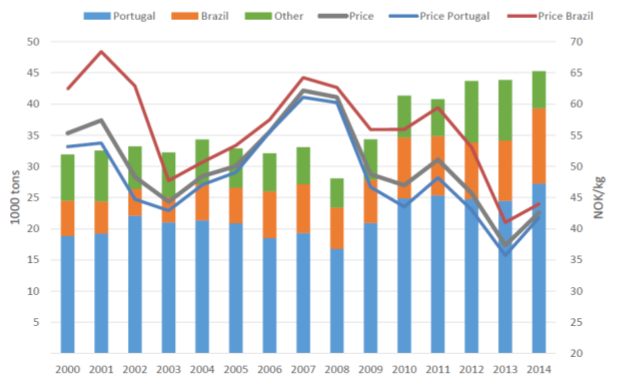
Clipfish have had a relative stable share of total export value until 2013, when it decreases from roughly 1/3 to 28 %, and then to 26 % in 2014. The volumes exported are relatively stable with right above 30 000 tons until 2008 when it falls back to 28 000 tons, before it increases steadily to 45 000 in 2014, Figure 31. The market for clipfish is primarily Portugal, who receives annually between 56 per cent and 2/3 of the clipfish export. Also Brazil is an important market – to a larger degree throughout the period – taking between 13 and 27 per cent.
Figure 31. Norwegian export of clipfish (volume and prices), 2000-2014
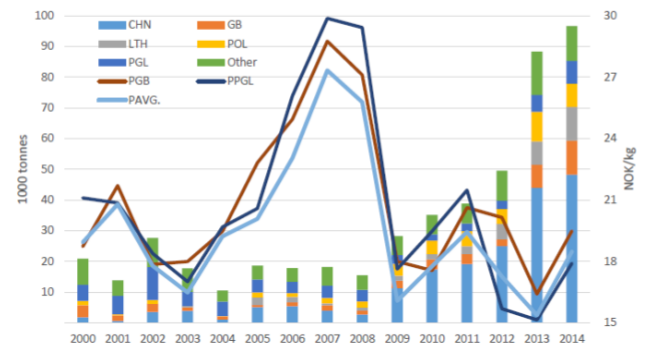
The export of frozen unprocessed cod is of relative new date, triggered by the filleting industry’s supply of fresh cod from Russian vessels after the break down in the early 1990’s, which enabled them to freeze the catch from own vessels and steer them to profitable market opportunities, just like the autoliners had been doing for years. By freezing the cod on-board right after catch, quality is kept intact and the logistic restrictions, regarding the raw materials deterioration possibilities is more or less curtailed. Figure 32 shows the vast increase in the export of unprocessed frozen cod in the years after 2008. Until then the annual quantities was in the range of 10–28 000 tonnes.
Thereafter it annually grew with 10-80 per cent annually. This growth is coinciding with quota increases and corresponding price falls, and to some degree the financial crisis in 2008/2009. The largest import counties have been relative stable over time. Since 2005, China becomes a main importer at the same time as Lithuania. At the end of the period, the exported volumes have increased from 20 000 to nearly 100 000 tonnes, and frozen round cod is the largest cod export product in volume, and the second largest in value – after clipfish.
Figure 32. Norwegian export of frozen cod (headed and gutted) to largest recipients
In the five-year period from 2008 to 2013, Norwegian cod landings rose from 200 to 450 000 tonnes, while average export price was halved, from 50 NOK/kg to 25 NOK/kg. The large increase in the export of unprocessed products can be due to both capacity reasons and the economic rationales behind. For more information on the development on the export of frozen cod, see for instance Egeness (2013).
Just as for the frozen round cod, the export of fresh round cod has gathered headway the later years. But unlike the frozen cod, fresh iced cod (“blank iset”) has always been an important high-end product directed for well-paying export markets in proximity to Norway, in order to keep the freshness of the product and its quality. Moreover, in recent years the Norwegian Seafood Council and Norges Råfisklag (the northernmost fishermen’s sales organisation) has in cooperation established an own copy-righted trademark named “SKREI”, which is exported fresh cod of good quality, caught in the spawning period (January–April) and packed on ice by in advance approved producers. This has been used since 2007 but will appear in the export statistics only from 2015. During the first half of 2015 (the main period for fresh cod export) approximately 10 per cent of the 42 000 tonnes of exported fresh cod was approved SKREI, and received a price premium of 20 per cent (NOK 30 vs. NOK 25 per kg).
Canada
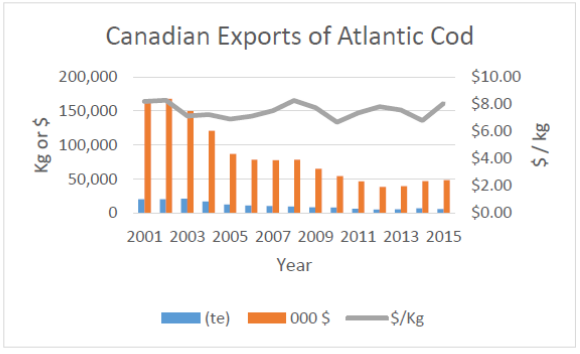
Canada is a major seafood exporting nation, ranked 7 th among the major exporters worldwide in terms of value. Exports of Atlantic cod however are minor on the global market. Exports of cod have decreased from 20,385 t in 2001 (€117 million) to 6,925 t in 2014 (€31 million) (average export price (€4.45), Figure 33. Similar trend can be observed for the export of cod from NL, however, on average, the export value of NL cod is lower than the national average. In 2014 the export price dropped to €3.67/kg, the lowest in 15 years. Major exporting destinations are the USA and the UK which in 2014 accounted for 48.6% and 39.4% of NL cod exports respectively.
Figure 33. Canadian exports (in $ CND) of Atlantic cod. Source; Statistics Canada, international Trade division
UK
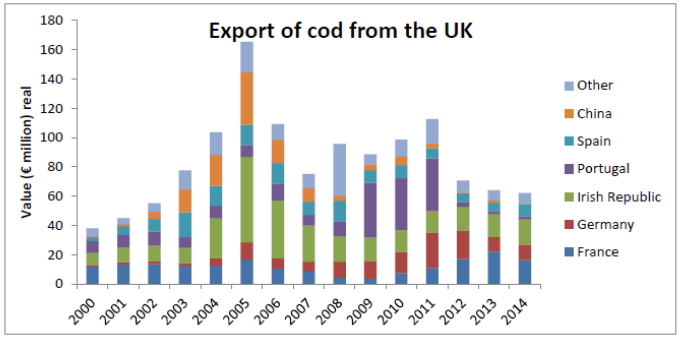
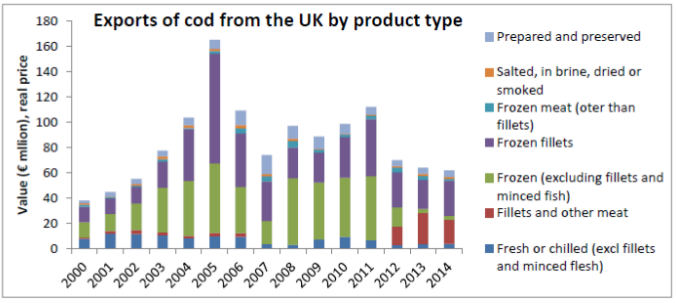
In 2014, the UK exported 14,900 tonnes of cod products (equivalent to 41,200 t live weight) with a with a total value of €62.1 million, a decline of about 50% since 2011, 92% of the total cod export from the UK was to other EU member states and 8% to non-EU countries; Within the EU, exports to France, Germany, Irish Republic, Portugal and Spain comprised 91% of the 91% of the total export to EU in 2014. China was the single biggest importer of UK cod outside the EU, Figure 34. Frozen fillets were the main type of product exported from the UK by volume and value in 2014, followed by fresh fillets and other meat, Figure 35.
Figure 34. Value of exports of cod from the UK by country of destination. Source: HM Revenue & Customs
Figure 35. Value of cod exports from the UK by type of product. Source: HM Revenue & Customs
Consumption
Canada
Canada’s per capita consumption of seafood has remained relatively stable since 1988 with an annual average of about 8.77kg/capita. The majority of the seafood is consumed from fresh and frozen state (47%), followed by processed fish (29%), shellfish (20%), freshwater fish (4%).
Iceland
The local consumption in Iceland is small percentage of the total cod caught. In 2013 were 3.800 tons consumed in Iceland of cod which is only a small part of the 225.000 tons caught that year. This is the official number but it is likely that the consumption is much higher of cod that does not come through documented channels. Most of the cod is sold through special fish monger shops, but big chunks are sold through the HORECA sector.
UK
The consumption of cod in 2014 represented about 23% of all fish consumed by UK households. In 2014, total retail sales of cod through the multiple retailers were worth €439 million at 43,104 tonnes.
Cod was the number one best-selling frozen seafood species, in both volume and value, selling around 16% more than the next, which was Alaskan pollack. Cod was also ranked as the second most popular species in chilled; and ranked 3 rd in total seafood sales, by both volume and value. In 2014, cod sales values were split virtually 50/50 between chilled and frozen formats. However, by volume, UK consumers purchase over twice as much frozen cod as they do chilled.
In 2014, total UK foodservice was worth €62.9 billion. This included 953 million out of home seafood servings, estimated to be worth over €3.72 billion.
Fried fish continues to dominate the foodservice sector with a 36% market share, followed by fish and seafood sandwiches that maintain their 30% share of servings.
In 2014 cod was the most popular species eaten out of home with 126 million servings, followed by haddock, prawns and salmon. Over 90% of the cod servings (€141.4 million) can be attributed to fish and chips, with the majority of sales distributed across the fish & chip and pub channels. There are approximately 10,500 takeaway fish and chip shops in the UK, collectively serving around 380 million meals per annum. Annual spend on fish and chips in the UK is around €1.36 billion.
Summary
Iceland and Norway are two of the world’s largest suppliers of cod, having access to abundant cod stocks in Norwegian and Icelandic waters. The catches have been growing over the last few years in in both Iceland and Norway. On the other hand, the UK has a small contribution to global catches even though quotas are slightly increasing. Since the collapse of the Canadian stocks of cod in early ‘90’s Canada has lost its global presence and its current landings represent a minor share of the global production of cod. There is an indication that cod stocks in Canada may be recovering, however.
In all countries a trend to consolidation in the industry towards fewer and larger vessels and companies has been observed. The bulk of the cod landings in Norway, Iceland and the UK are delivered by relatively large vessels, while in Canada – by boat of less than 10m in length. There have been changes in the gear in Iceland – a movement away from gillnets towards trawl and long line. This can be explained to some extent by the better quality of product resulting from these methods of fishing. In recent years Iceland has specialised in the production and export of fresh fillets, quality has become highly important.
A large and increasing proportion of the Norwegian catch is landed frozen, while in Iceland the number of freeze trawlers have declined in recent years, in a move towards fresh landing and processing on land. The UK fleet lands its catches of cod whole fresh or gutted and a significant proportion of its catch in other countries in foreign countries. The vast majority of Canadian catches of cod are landed as fresh fish, destined primarily for primary processing and local retailing. Compared to Norway, Iceland benefits from lower variation in landings throughout the year which is an advantage when it comes to supplying multiple retail chains requiring continuity and predictability of supply.
Besides landings by foreign vessels in Norway, imports of cod in Iceland and Norway are not present to any significant extent since these countries are more than self-sufficient in cod. The UK on the other hand is a major market and importer of cod products, particularly frozen fillets which represent the highest share of imports. The main exporting countries to the UK are Iceland, China and Norway. Due to limited domestic supply, Atlantic cod is also imported into Canada for further processing and re-export and to supplement domestic markets but imports have declined in the last decade.
Cod processing in Norway, Iceland and the UK has undergone significant consolidation resulting in fewer but larger companies. In Iceland the consolidation process has resulted in increased investment and modernisation leading to improved productivity and rising profitability. In Iceland cod is predominantly processed into fresh fillets for export and the share of salted and dried products has declined over time. In Norway, a significant proportion of cod is processed into dried and/or salted fish as well as frozen whole. The majority of UK companies processing cod specialise in secondary processing, primarily of imported frozen fillets into value added products. The Canadian processing sector consists of mainly small-scale primary processing companies, reliant partly on imports and partly on domestic landings.
The vast majority of the cod landed and processed in Iceland and Norway is exported. The main export markets for cod from Iceland are within the EU. Similarly, large proportion of the Norwegian exports target EU countries. In Norway the share of unprocessed whole gutted cod has increased in the last few years, particularly to China and Lithuania, where the fish undergoes further processing. Norway is also a main supplier of salted and dried fish to Portugal, which represents the largest market for these products. Exports from the UK are minor compared to Iceland and Norway and target mainly other EU member states. Canadian exports are also small and declining with the US and UK the major destinations.
Detailed data on retail and consumption exists only for the UK, where cod is one of the three most consumed species, along with salmon and tuna. The majority of cod sales in the UK are achieved through the retail sector and in the form of either fresh or frozen products. A large proportion of cod is also sold through food service outlets in the form the traditional ‘fish and chips. In Iceland cod in the domestic market is mainly retailed through fishmongers and Horeca.
Conclusion
Bibliography

