Difference between revisions of "WTP"
Jacandrade (talk | contribs) |
|||
| (4 intermediate revisions by 2 users not shown) | |||
| Line 10: | Line 10: | ||
---- | ---- | ||
| − | The average apparent fish consumption per capita in the EU is the second highest in the world | + | The average apparent fish consumption per capita in the EU is the second highest in the world (at around 22 kg/capita/year), and some individual EU Member States are among the highest fish consuming countries in the world (EEA, 2016). |
| − | (at around 22 kg/capita/year), and some individual EU Member States are among the highest fish consuming | ||
| − | countries in the world (EEA, 2016) | ||
| − | |||
| − | |||
| − | |||
| − | |||
| − | |||
| − | |||
| − | |||
| − | |||
| − | |||
| − | |||
| − | |||
| − | |||
| − | |||
| − | |||
| − | |||
| − | |||
| − | |||
| − | |||
| − | |||
| − | |||
| − | |||
| − | |||
| − | |||
| − | |||
| − | |||
| − | |||
| − | |||
| − | |||
| − | |||
| − | |||
| − | |||
| − | |||
| − | |||
| − | |||
| − | | + | The EU is the largest market in the world for fish; with a value of €55 billion and a volume of 12 million tons (FAO, 2016). While EU fish and seafood consumption has risen over the past 10 years with stable or declining supply from the fisheries sector, most of this increase has come from imports rather than from EU aquaculture. |
| + | |||
| + | In 2014, around 75% of fisheries and aquaculture products consumed in the EU came from marine capture fisheries, which remains consistent with trends over the last decade (EUMOFA, 2015). Today 25% of all EU seafood consumption comes from EU fisheries, 10% from EU aquaculture and 65% from imports from third countries, both fisheries and aquaculture products. | ||
| + | |||
| + | European aquaculture growth has stagnated since the turn of the century partly because its products have not been competitive compared with imports. In a market driven by the demand a better understanding of consumer purchasing behaviour towards fish products is paramount to developing more effective marketing and policy strategies. Therefore, understanding the consumers’ preferences across the EU countries for fish species and fish product attributes is crucial to sustain the fisheries and aquaculture sectors. | ||
| + | |||
| + | The objective of this study was to investigate consumer demand and choice behaviour for fresh fish at the retail market. In particular, we examined consumer preferences for different fish alternative species, as well as different attributes. The outcomes allowed us to elicit consumers’ preferences and willingness to pay (WTP) for the salient attributes of a variety of fresh fish species in the retail market. | ||
| + | |||
| + | Data for this study were collected in June 2017 through a nationwide online survey administered in the five countries (Italy, France, Spain, UK and Germany). The final experimental design consisted in five attributes, defined for the seven fish alternatives (trout, herring, salmon, sea bass, sea bream, cod and pangasius): price (average market price +/-30%), production method (wild-caught, farm-raised), format (whole/round cut, fillet, ready-to-cook), sustainability certification, nutrition and health claim. The questionnaire included questions regarding socio-demographics, fish frequency of consumption, past consumption, level of responsibility in fish purchasing and cooking, fish choice motives, attitude towards environmental concerns, attitude towards health concerns, self-efficacy, trust, and attitude towards ready-to-cook fish. | ||
| + | |||
| + | A discrete choice experiment (DCE) was applied to accomplish this objective; this method is strongly consistent with the economic demand theory and in particular with the multi-attribute demand studies based on the Lancastrian consumer theory .This theory assumes that consumer’s utility stems from product properties rather than the products themselves. Thus, multi-attribute demand models can elicit the intrinsic value of the product attributes and have been applied widely in marketing research. Moreover, this method is highly flexible with respect to data collection and model specifications. DCE is based on random utility theory about individual decision making, and seems realistic in imitating real shopping behaviour (Louviere et al., 2000). | ||
| + | |||
| + | Choice modelling techniques are multi-attribute valuation techniques that elicit values for multiple attributes by asking respondents to rate, rank or choose a set of attributes (levels). In particular, choice experiments are valuation techniques where respondents have to make trade-offs and indicate their preferred option out of a set of alternatives. | ||
| + | |||
| + | The choice-based on-line experiment included 500 respondents per country (Italy, France, Spain, UK and Germany). The profile attributes and levels analysed are derived from previous qualitative tasks (i.e., qualitative analysis by in-person interviews), and include product innovation features such as health claims, sustainability certification, etc. To accommodate the evaluation of choice alternatives through both attribute judgment and alternative comparison, we applied a labelled choice experiment (LCE), where choice alternatives were labelled by the respective names of the seafood (e.g., salmon, cod, herring, etc.) (Nguyen et al., 2015). We set our model specification in such a way that the constant terms, which represent intrinsic value of the alternatives, and attribute parameters were varied both over fish alternatives and across countries. The WTP associated with each attribute, by species and country, was also estimated. | ||
| + | |||
| + | == Tool overview == | ||
| + | |||
| + | The tool contains the explanation necessary to understand its workings and results. Once you select the product attributes and click the Run button, a results page will be displayed containing the results and an analytical explanation of its contents. | ||
| + | |||
| + | === Landing page === | ||
| + | |||
| + | The WTP home page is quite straight forward and offers a general description of the tool. The home page displays different inputs, and also provides links to this wiki page for deeper information about the research and tool. | ||
| + | |||
| + | [[File:Wtp home.png|home]] | ||
| + | |||
| + | === Reference and pictures for Presentation format (whole fish, fillet, ready-to-cook) === | ||
| + | |||
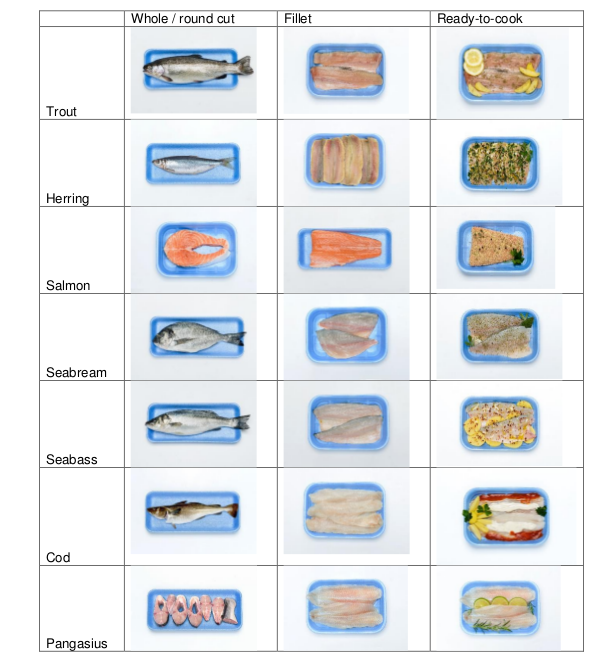
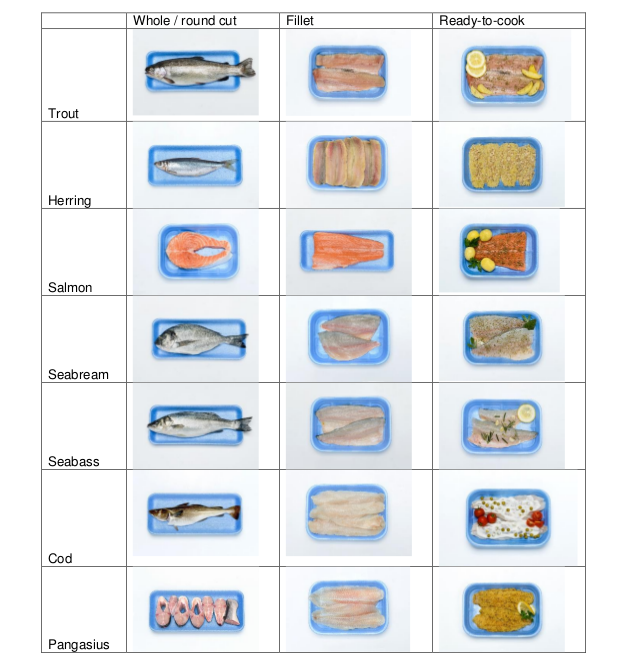
| + | The DSS Willingness To Pay is the result of a methodology called “choice modelling”, where consumers participating in an online experiment have indicated their preference for a set of goods. While choosing one alternative instead of another, consumers indicate their preference on a fish species (e.g., cod), and on a particular combination of the following characteristics (what we call “attributes”): | ||
| + | |||
| + | *Price | ||
| + | *Production method (farm-raised or wild-caught fish) | ||
| + | *Presentation format (whole fish, fillet, ready-to-cook) | ||
| + | *Sustainability label | ||
| + | *Nutritional and health claim | ||
| + | |||
| + | 'Here is a set of pictures of the Presentation format attribute, by species in each country. | ||
| + | |||
| + | ===== France ===== | ||
| + | |||
| + | [[File:Wtp table a3 france.png|center|WTP Table A3 - France.]] | ||
| + | |||
| + | ===== Germany ===== | ||
| + | |||
| + | [[File:Wtp table a3 germany.png|center|WTP Table A3 - Germany.]] | ||
| + | |||
| + | ===== Italy ===== | ||
| + | |||
| + | [[File:Wtp table a3 italy.png|center|WTP Table A3 - Italy.]] | ||
| + | |||
| + | ===== Spain ===== | ||
| + | [[File:Wtp table a3 spain.png|center|WTP Table A3 - Spain.]] | ||
| − | == | + | ===== UK ===== |
| − | + | [[File:Wtp table a3 uk.png|center|WTP Table A3 - UK.]] | |
| − | |||
| − | |||
| − | + | | |
| − | + | === Results === | |
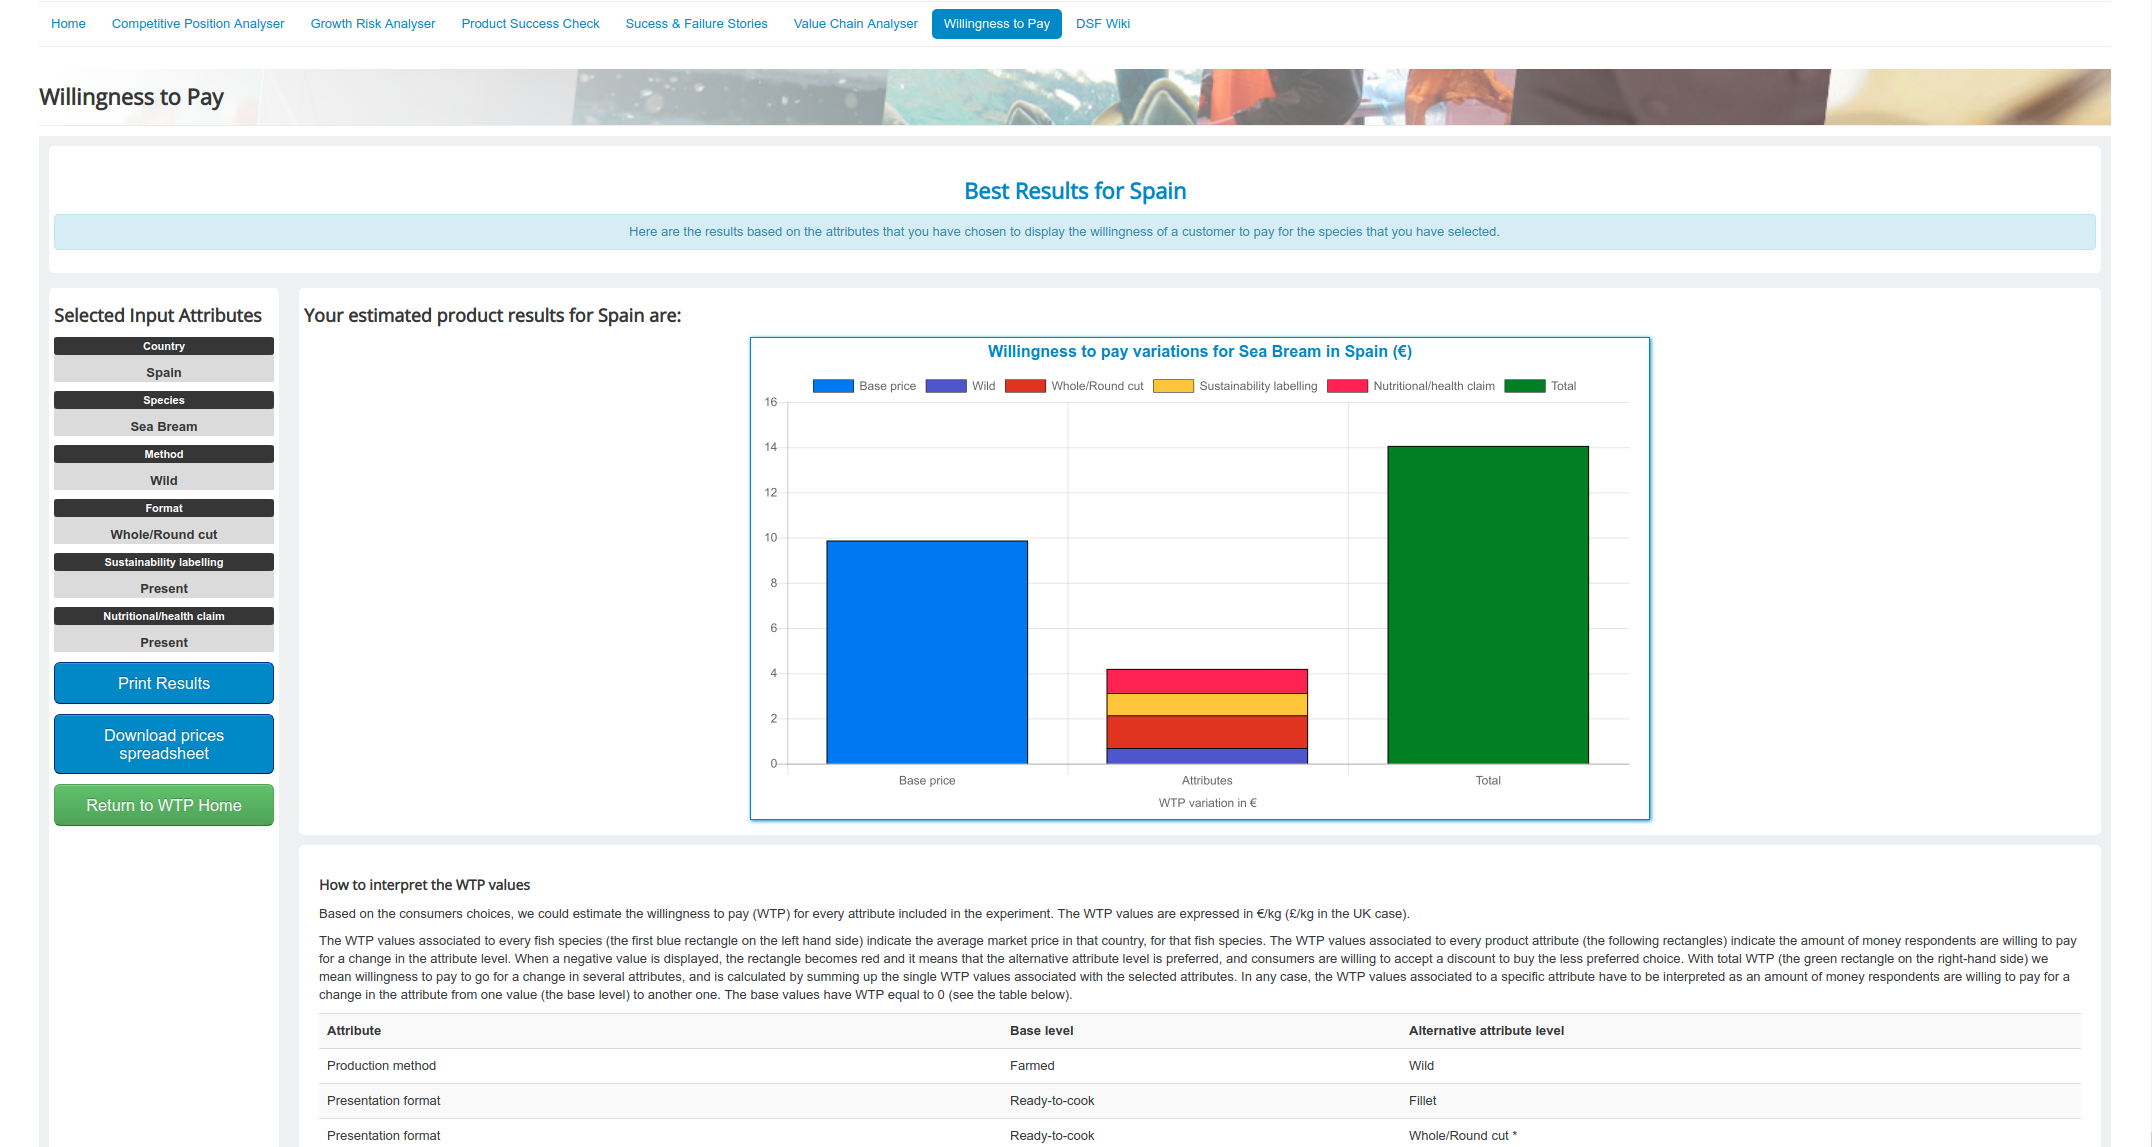
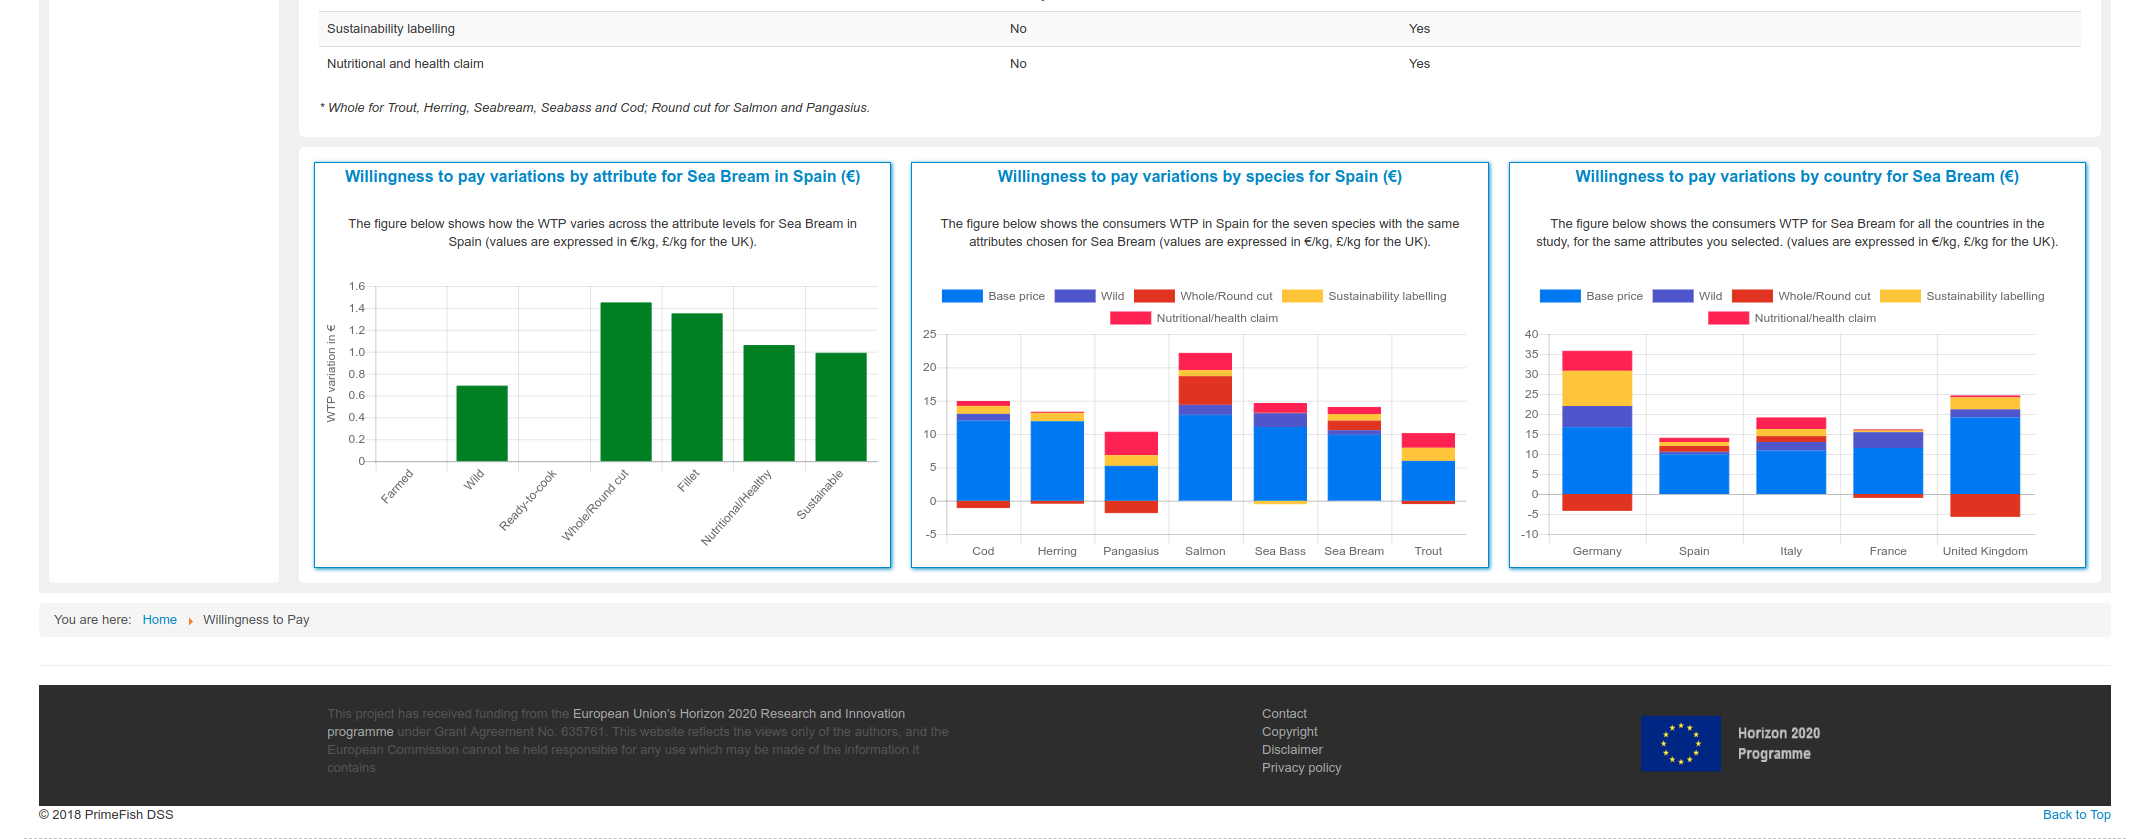
| − | + | The results page displays firstly a Bar chart highlighting the base price and the WTP variations for the selected inputs, followed by a quick general explanation about the results. At the bottom, a graphical comparison of the WTP variation for the different attributes of the chosen species and country, followed by a chart of the WTP variation by country and species for the same input choices for the product. | |
| − | [[File: | + | [[File:Wtp results 1.png|results]] [[File:Wtp results 2.png|results]] |
| − | ==References & readings== | + | == References & readings == |
Latest revision as of 10:21, 28 September 2018
Contents
Willingness to Pay
Introduction
The average apparent fish consumption per capita in the EU is the second highest in the world (at around 22 kg/capita/year), and some individual EU Member States are among the highest fish consuming countries in the world (EEA, 2016).
The EU is the largest market in the world for fish; with a value of €55 billion and a volume of 12 million tons (FAO, 2016). While EU fish and seafood consumption has risen over the past 10 years with stable or declining supply from the fisheries sector, most of this increase has come from imports rather than from EU aquaculture.
In 2014, around 75% of fisheries and aquaculture products consumed in the EU came from marine capture fisheries, which remains consistent with trends over the last decade (EUMOFA, 2015). Today 25% of all EU seafood consumption comes from EU fisheries, 10% from EU aquaculture and 65% from imports from third countries, both fisheries and aquaculture products.
European aquaculture growth has stagnated since the turn of the century partly because its products have not been competitive compared with imports. In a market driven by the demand a better understanding of consumer purchasing behaviour towards fish products is paramount to developing more effective marketing and policy strategies. Therefore, understanding the consumers’ preferences across the EU countries for fish species and fish product attributes is crucial to sustain the fisheries and aquaculture sectors.
The objective of this study was to investigate consumer demand and choice behaviour for fresh fish at the retail market. In particular, we examined consumer preferences for different fish alternative species, as well as different attributes. The outcomes allowed us to elicit consumers’ preferences and willingness to pay (WTP) for the salient attributes of a variety of fresh fish species in the retail market.
Data for this study were collected in June 2017 through a nationwide online survey administered in the five countries (Italy, France, Spain, UK and Germany). The final experimental design consisted in five attributes, defined for the seven fish alternatives (trout, herring, salmon, sea bass, sea bream, cod and pangasius): price (average market price +/-30%), production method (wild-caught, farm-raised), format (whole/round cut, fillet, ready-to-cook), sustainability certification, nutrition and health claim. The questionnaire included questions regarding socio-demographics, fish frequency of consumption, past consumption, level of responsibility in fish purchasing and cooking, fish choice motives, attitude towards environmental concerns, attitude towards health concerns, self-efficacy, trust, and attitude towards ready-to-cook fish.
A discrete choice experiment (DCE) was applied to accomplish this objective; this method is strongly consistent with the economic demand theory and in particular with the multi-attribute demand studies based on the Lancastrian consumer theory .This theory assumes that consumer’s utility stems from product properties rather than the products themselves. Thus, multi-attribute demand models can elicit the intrinsic value of the product attributes and have been applied widely in marketing research. Moreover, this method is highly flexible with respect to data collection and model specifications. DCE is based on random utility theory about individual decision making, and seems realistic in imitating real shopping behaviour (Louviere et al., 2000).
Choice modelling techniques are multi-attribute valuation techniques that elicit values for multiple attributes by asking respondents to rate, rank or choose a set of attributes (levels). In particular, choice experiments are valuation techniques where respondents have to make trade-offs and indicate their preferred option out of a set of alternatives.
The choice-based on-line experiment included 500 respondents per country (Italy, France, Spain, UK and Germany). The profile attributes and levels analysed are derived from previous qualitative tasks (i.e., qualitative analysis by in-person interviews), and include product innovation features such as health claims, sustainability certification, etc. To accommodate the evaluation of choice alternatives through both attribute judgment and alternative comparison, we applied a labelled choice experiment (LCE), where choice alternatives were labelled by the respective names of the seafood (e.g., salmon, cod, herring, etc.) (Nguyen et al., 2015). We set our model specification in such a way that the constant terms, which represent intrinsic value of the alternatives, and attribute parameters were varied both over fish alternatives and across countries. The WTP associated with each attribute, by species and country, was also estimated.
Tool overview
The tool contains the explanation necessary to understand its workings and results. Once you select the product attributes and click the Run button, a results page will be displayed containing the results and an analytical explanation of its contents.
Landing page
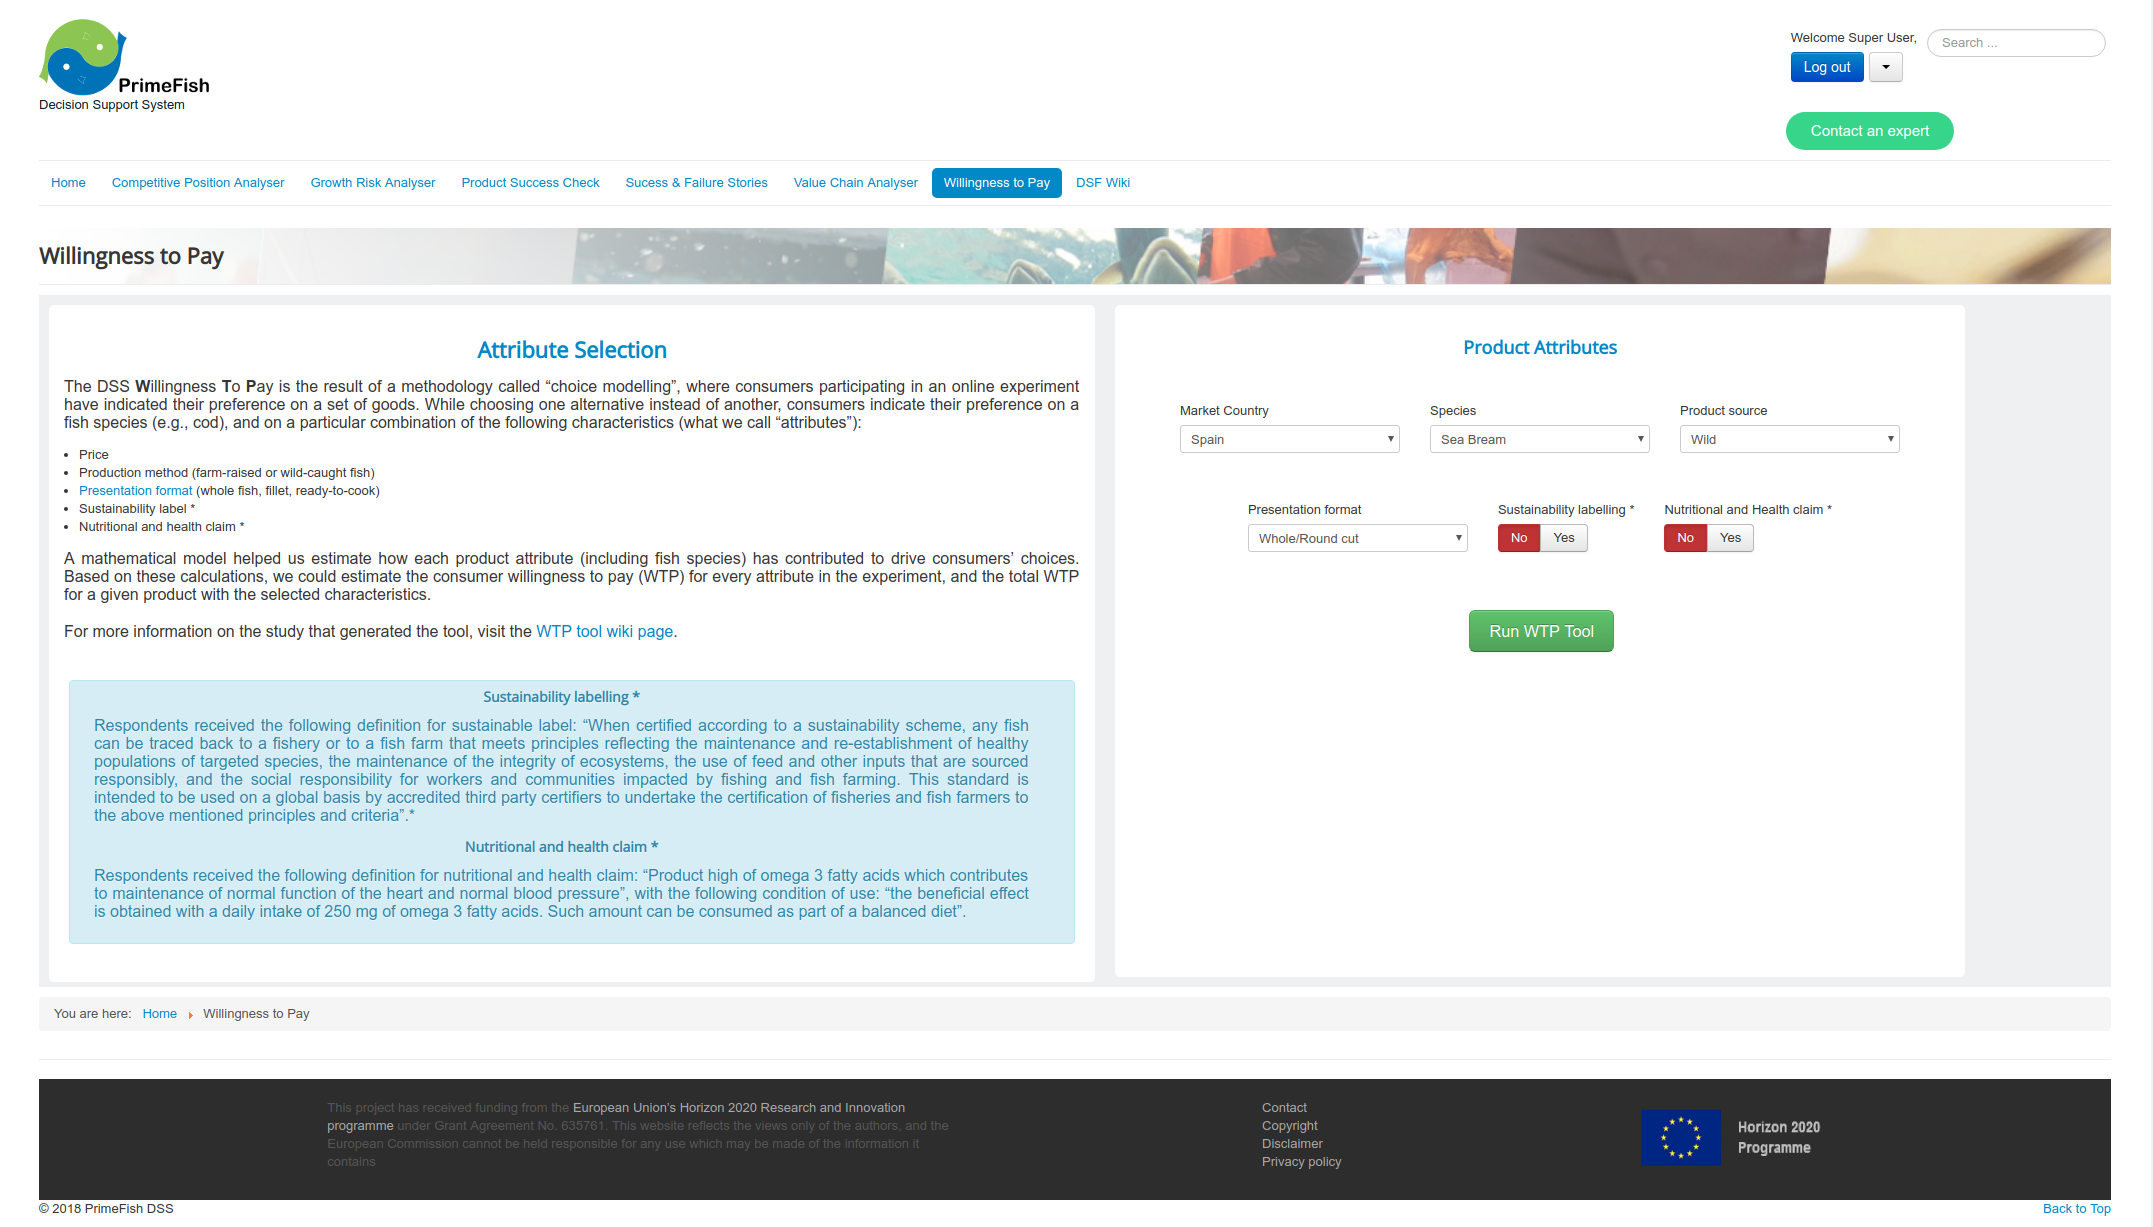
The WTP home page is quite straight forward and offers a general description of the tool. The home page displays different inputs, and also provides links to this wiki page for deeper information about the research and tool.
Reference and pictures for Presentation format (whole fish, fillet, ready-to-cook)
The DSS Willingness To Pay is the result of a methodology called “choice modelling”, where consumers participating in an online experiment have indicated their preference for a set of goods. While choosing one alternative instead of another, consumers indicate their preference on a fish species (e.g., cod), and on a particular combination of the following characteristics (what we call “attributes”):
- Price
- Production method (farm-raised or wild-caught fish)
- Presentation format (whole fish, fillet, ready-to-cook)
- Sustainability label
- Nutritional and health claim
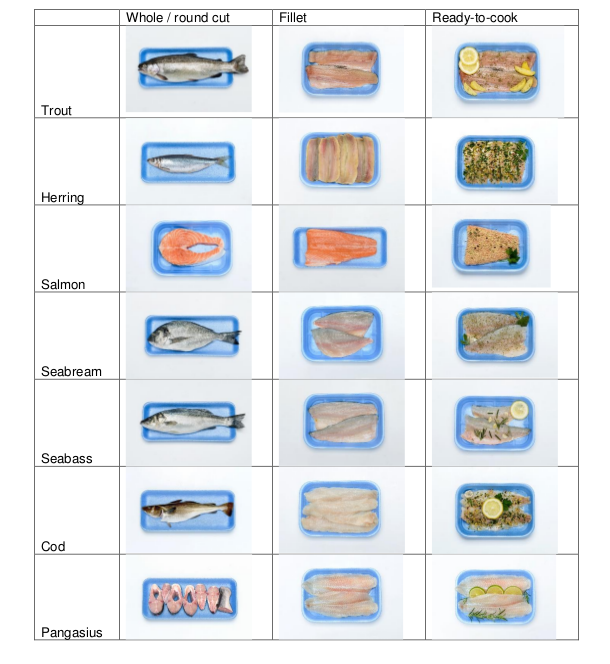
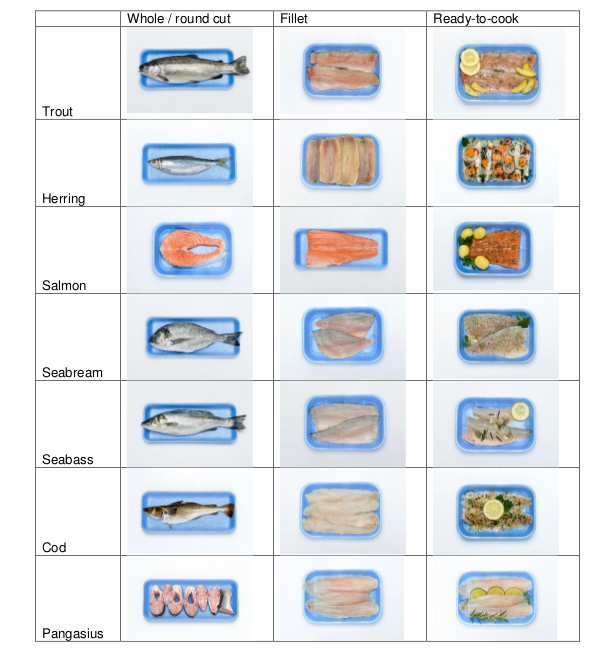
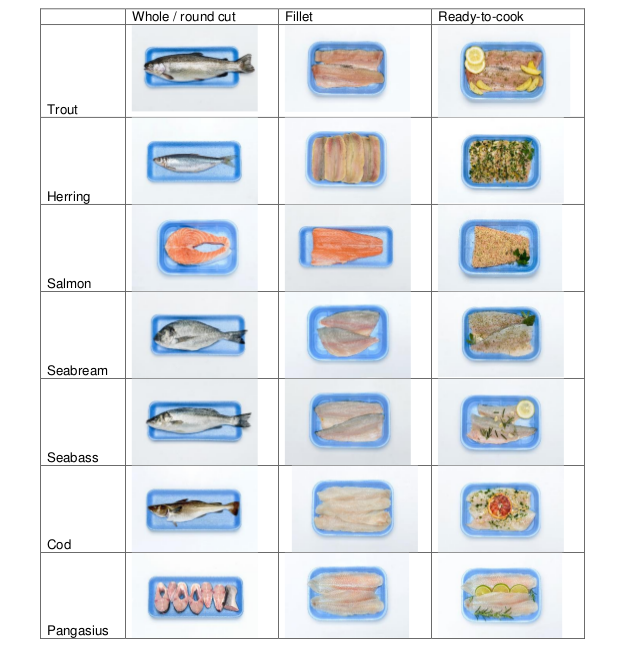
'Here is a set of pictures of the Presentation format attribute, by species in each country.
France
Germany
Italy
Spain
UK
Results
The results page displays firstly a Bar chart highlighting the base price and the WTP variations for the selected inputs, followed by a quick general explanation about the results. At the bottom, a graphical comparison of the WTP variation for the different attributes of the chosen species and country, followed by a chart of the WTP variation by country and species for the same input choices for the product.

